What Is Synthetic Aperture Radar and How Does It Work?

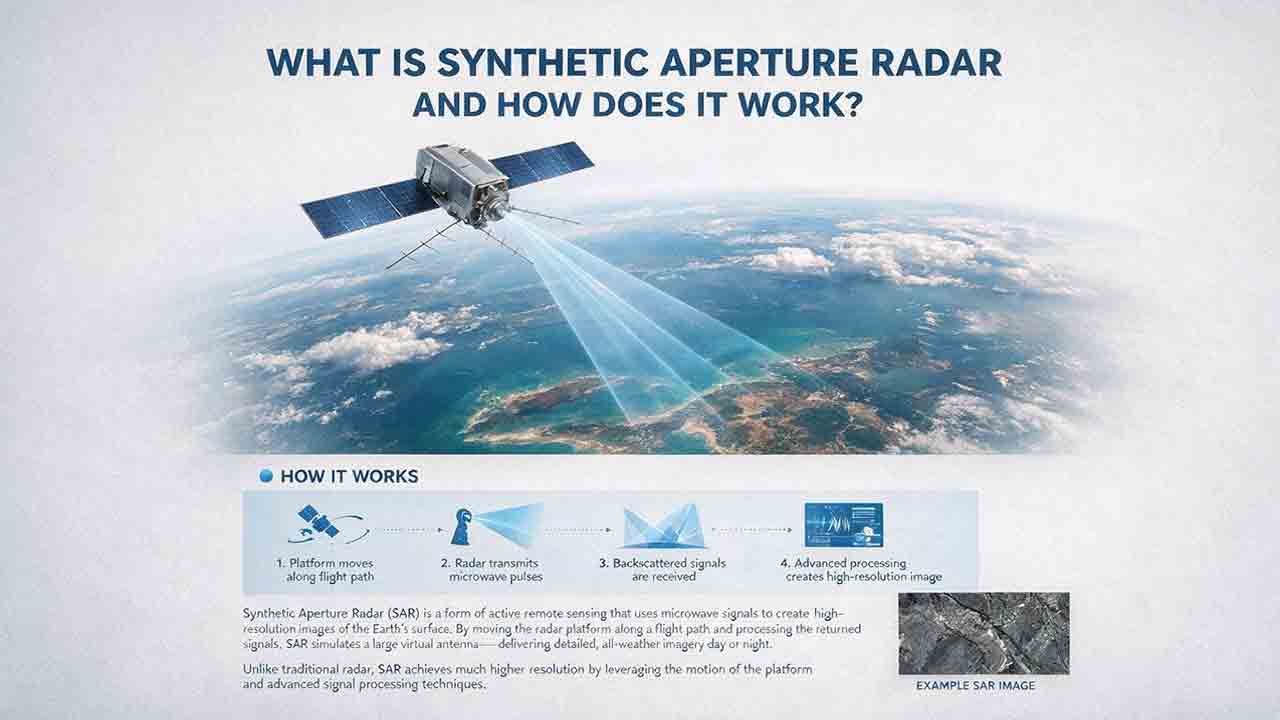
Synthetic aperture radar, or SAR, is an active imaging system that sends microwave pulses toward Earth and records the returning echoes. As a satellite or aircraft moves, signal processing combines measurements collected from many positions into a much larger virtual antenna. This allows SAR to create detailed images during the day or night and through most cloud cover.
Key Takeaways
- SAR supplies its own microwave energy, so it does not depend on sunlight.
- The synthetic aperture is created through platform motion and signal processing, not by installing an extremely long physical antenna.
- SAR brightness represents radar backscatter, not visible color or surface temperature.
- Wavelength, polarization, moisture, roughness, terrain, and viewing geometry all influence the image.
- Reliable conclusions usually require compatible observations and independent supporting evidence, not one isolated scene.
This guide explains how radar echoes become an image, what bright and dark SAR pixels mean, when radar is more useful than optical imagery, and how to select suitable data for a practical Earth-observation project.
Method note: This guide is based on authoritative technical documentation, published specifications, transparent calculations, and practical selection criteria rather than hands-on product testing.
How Does Synthetic Aperture Radar Work?
Synthetic aperture radar works by transmitting microwave pulses, recording the timing, strength, and phase of the returning signals, and combining observations collected as the radar platform moves.
Unlike a conventional camera, SAR does not produce its final image from one exposure. It builds the image from a sequence of coherent measurements.
The Signal-to-Image Path
The following original diagram summarizes the complete process:
| Platform motion | Signal collection | Synthetic-aperture processing | Final output |
|---|---|---|---|
| Satellite position A → B → C | The same ground target is observed repeatedly | Timing, amplitude, phase, and Doppler histories are combined | A focused, calibrated, and geolocated SAR image |
The platform’s movement is not merely transportation between observations. It is part of the imaging method itself.
1. The Radar Transmits Microwave Pulses
A SAR instrument is an active sensor, meaning it provides the energy used to observe Earth.
The antenna sends encoded microwave pulses toward the surface. Most airborne and spaceborne SAR systems look sideways rather than directly beneath the platform.
This side-looking geometry allows the radar to distinguish targets according to their distance from the sensor.
2. The Signal Interacts With the Surface
When a pulse reaches the ground, its energy may be:
- Reflected toward the radar
- Scattered in other directions
- Absorbed by the material
- Transmitted into vegetation, soil, snow, or ice to a wavelength-dependent depth
The portion that returns to the antenna is called backscatter.
Backscatter depends on both the target and the radar configuration. The same forest, field, road, or building may look different when observed with another wavelength, polarization, incidence angle, or orbit direction.
3. Echo Timing Provides Range Information
The radar records how long each pulse takes to travel to the surface and return.
Because electromagnetic waves travel at approximately the speed of light, the round-trip travel time can be converted into the distance between the radar and the target.
The measured distance along the radar beam is called slant range.
4. The Radar Records Amplitude and Phase
SAR observations preserve two important signal properties:
- Amplitude describes the strength of the returned signal.
- Phase records the returned wave’s position within its repeating cycle.
Amplitude is commonly used to produce radar-intensity or calibrated-backscatter images.
Phase supports coherent comparisons between acquisitions, including interferometric synthetic aperture radar. It must be interpreted together with timing, wavelength, orbit, and processing information; phase alone is not an unrestricted absolute-distance measurement.
5. Platform Motion Creates the Synthetic Aperture
A physical antenna mounted on a satellite is too short to provide extremely fine along-track resolution by itself.
SAR solves this limitation by observing the same ground target from a sequence of positions as the spacecraft or aircraft moves forward. Each observation contains slightly different phase and Doppler information.
Processing software combines these coherent measurements as though they had been collected by one much longer antenna. That virtual antenna is the synthetic aperture.
NASA Earthdata explains this geometry in its official Synthetic Aperture Radar overview.
6. Processing Focuses the Echoes Into an Image
Raw radar measurements must be processed before they become a useful map.
Depending on the product and application, processing may include:
- Range compression
- Azimuth compression
- Radiometric calibration
- Multilooking
- Speckle filtering
- Geocoding
- Terrain correction
- Coregistration with other acquisitions
The finished image is not a conventional photograph. It is a spatial representation of measured microwave backscatter, sometimes accompanied by phase, coherence, incidence-angle, or quality information.
A visually clean SAR image may still be unsuitable for analysis if its calibration, geometry, or processing does not match the question being asked.
Why Is the Aperture Synthetic?
The aperture is called synthetic because the radar uses its movement to imitate an antenna much longer than the physical antenna carried by the spacecraft.
Antenna length affects how well a radar can distinguish nearby targets in the direction of flight. A real-aperture radar operating from orbit would need an impractically long antenna to achieve fine along-track resolution.
SAR replaces much of that physical length with coherent observations collected over time.
As the platform passes a target, changing distance and relative motion produce a predictable signal history. Processing that history allows the echoes to be focused into a smaller image cell.
Range and Azimuth Are Different Directions
A SAR image has two primary dimensions:
| Direction | What it describes | Main resolution control |
|---|---|---|
| Range | Across the flight path, toward or away from the radar | Signal bandwidth and pulse-compression processing |
| Azimuth | Along the direction of flight | Synthetic aperture and Doppler processing |
Range and azimuth resolution are produced differently and should not be treated as interchangeable.
A delivered map may contain square pixels even when its effective range and azimuth resolutions are not identical.
How Is SAR Range Resolution Calculated?
For a simplified ideal pulse-compression case, slant-range resolution can be approximated by:
ΔR ≈ c / (2B)
Where:
- ΔR is idealized slant-range resolution
- c is the speed of light
- B is the transmitted signal bandwidth
The equation describes an idealized relationship. It is not the complete resolution specification of a finished map product.
The official NOAA SAR Marine User’s Manual hosted by NASA Earthdata describes the relationship between effective pulse bandwidth and range resolution.
Example Using 20 MHz of Bandwidth
Using an approximate speed of light of 300,000,000 meters per second:
ΔR ≈ 300,000,000 / (2 × 20,000,000)
ΔR ≈ 7.5 meters
The following values are transparent calculations from the same equation. They are educational examples, not measured specifications for a particular satellite.
| Signal bandwidth | Calculated idealized slant-range resolution |
|---|---|
| 10 MHz | 15 meters |
| 20 MHz | 7.5 meters |
| 40 MHz | 3.75 meters |
Within this simplified model, doubling the bandwidth halves the idealized slant-range resolution value.
Why the Delivered Resolution May Differ
The calculation above does not directly provide:
- Ground-range resolution
- Azimuth resolution
- Pixel spacing
- Geolocation accuracy
- Minimum detectable object size
A finished product may also be affected by:
- Incidence angle
- Signal-windowing choices
- Multilooking
- Noise reduction
- Resampling
- Terrain correction
- Product-generation methods
Pixel spacing is the interval between sampled pixel centers. Spatial resolution is the ability to distinguish separate targets.
A file with pixels spaced every 10 meters does not necessarily resolve two objects that are 10 meters apart.
What Does a SAR Pixel Represent?
A SAR pixel represents the measured radar response from an area on Earth, not the area’s visible color.
Bright pixels usually indicate that relatively strong radar energy returned to the sensor. Dark pixels usually indicate a weaker return.
That distinction does not identify the target by itself.
A strong return can come from a building, wet rough soil, a radar-facing slope, or flooded vegetation. A weak return can come from calm water, radar shadow, smooth pavement, or dry flat ground.
The Four-Question SAR Interpretation Check
The following framework is a practical interpretation tool developed for this guide. It is not an official scientific standard.
Before assigning meaning to a bright or dark area, ask:
- How rough is the surface relative to the radar wavelength?
- What material or moisture conditions are present?
- How is the target oriented toward the radar?
- Which wavelength, polarization, and incidence angle were used?
| Question | What to examine | Why it matters |
|---|---|---|
| Surface roughness | Smooth, plowed, rocky, rippled, or structurally complex surfaces | Rough surfaces often scatter more energy toward the sensor |
| Material and moisture | Dry soil, wet soil, vegetation, snow, ice, water, or metal | Water content and electrical properties alter radar response |
| Target geometry | Slopes, walls, trunks, streets, and their orientation | Geometry can strengthen, redirect, or block the return |
| Radar configuration | Band, polarization, incidence angle, orbit direction, and mode | Different configurations interact with different parts of the target |
For beginners, viewing geometry is often the missing piece. The same landscape may look substantially different when observed from the opposite direction.
An Evidence Ladder for SAR Interpretation
A defensible interpretation can be built in four stages:
- Pixel response: Is the return relatively strong or weak?
- Spatial pattern: Does its shape match a plausible surface feature?
- Temporal behavior: Does the pattern persist or change consistently?
- Independent support: Do terrain, weather, optical imagery, gauges, or field observations support the conclusion?
The strongest conclusion rarely begins and ends with image brightness.
What Are the Main SAR Scattering Mechanisms?
The most common SAR scattering patterns are specular reflection, rough-surface scattering, double-bounce scattering, and volume scattering.
| Scattering mechanism | Typical appearance | Common examples | Important caution |
|---|---|---|---|
| Specular reflection | Often dark | Calm water, smooth pavement, flat wet soil | Wind or small waves can make water brighter |
| Rough-surface scattering | Moderate to bright | Plowed fields, bare rock, rough ice | Roughness is relative to wavelength and viewing angle |
| Double-bounce scattering | Often very bright | Building-and-ground combinations, flooded tree trunks | Target orientation strongly affects the response |
| Volume scattering | Textured; often apparent in cross-polarized data | Forest canopies, shrubs, snow layers | Response changes with wavelength, density, structure, and moisture |
Why Calm Water Often Appears Dark
A calm water surface can behave like a mirror.
Most radar energy reflects away from the side-looking sensor rather than returning to the antenna. The water may therefore appear dark.
Wind, waves, ice, vegetation, or floating material can increase the return. Dark pixels are also not unique to water.
Why Some Urban Areas Appear Bright
Buildings and streets can form right-angle structures.
A radar pulse may reflect from the ground to a wall and then return toward the sensor. This double-bounce path can produce a strong signal.
The effect depends on orientation. A street grid facing the radar may look different from the same grid observed from another direction.
Why Forests Have a Complex Texture
Microwave energy may interact with leaves, branches, trunks, and the ground beneath a canopy.
Returns from many scatterers combine with different phases, producing a textured response. The result depends on wavelength, polarization, vegetation structure, moisture, and viewing geometry.
Longer wavelengths may interact more strongly with larger branches and trunks, but they do not provide a universally clear view through every forest.
How Is SAR Different From Optical Satellite Imagery?
SAR measures microwave backscatter. Optical sensors measure reflected or emitted energy in visible, infrared, or thermal wavelengths.
Neither system is universally better. The better choice depends on the physical question.
| Feature | Synthetic aperture radar | Optical satellite imagery |
|---|---|---|
| Energy source | Transmits its own microwave signal | Usually measures reflected sunlight; thermal sensors measure emitted energy |
| Night operation | Yes | Reflective optical bands generally require daylight |
| Cloud capability | Usually observes through cloud cover | Clouds often block the surface |
| Visual interpretation | Less intuitive | Often closer to human vision |
| Main measurement | Backscatter amplitude and phase | Spectral reflectance or thermal emission |
| Strong sensitivities | Structure, roughness, moisture, geometry, and electrical properties | Color, pigments, minerals, water absorption, and temperature |
| Terrain effects | Foreshortening, layover, and radar shadow | Relief displacement and shadows, with different geometry |
| Common uses | Floods, deformation, ice, crop structure, and maritime monitoring | Land cover, vegetation condition, burn severity, minerals, and true-color mapping |
The European Space Agency describes Sentinel-1 as a C-band SAR mission capable of observing Earth regardless of daylight and through cloud and rain. See the official Sentinel-1 instrument overview.
Which Should You Use?
Choose SAR when the central question involves:
- Cloud-covered or dark conditions
- Surface or vegetation structure
- Moisture-related change
- Flooding
- Ground deformation
- Ice movement
- Ships or ocean-surface patterns
Choose optical imagery when the central question involves:
- Visible surface appearance
- Vegetation pigments
- Mineral or material spectra
- Burn severity
- Water color
- Surface temperature, when thermal bands are available
Use both when the measurements provide complementary evidence.
For example, agricultural monitoring may combine optical vegetation indices with radar observations sensitive to crop structure, roughness, and moisture.
The important question is not which image looks more detailed. It is which measurement responds most directly to the process being studied.
Which Radar Wavelength Should You Use?
The most suitable wavelength depends on the size and depth of the structures with which the signal needs to interact.
Radar-band boundaries vary slightly among technical references. The ranges below should therefore be treated as approximate rather than universal cutoffs.
| Band | Approximate wavelength | Typical interaction tendency | Common applications |
|---|---|---|---|
| X-band | About 2.4–3.8 cm | Small surface features and upper vegetation layers | Urban mapping, snow, ice, and fine-resolution imaging |
| C-band | About 3.8–7.5 cm | Surface features and upper-to-intermediate vegetation structure | Floods, agriculture, oceans, sea ice, and broad change detection |
| S-band | About 7.5–15 cm | Intermediate vegetation and surface structures | Agriculture, vegetation, and land monitoring |
| L-band | About 15–30 cm | Larger branches, trunks, and deeper canopy interaction | Forest structure, biomass studies, geology, and deformation |
NASA Earthdata provides these approximate bands and explains how wavelength changes target interaction in its SAR fundamentals guide.
A Current Multi-Band Example: NISAR
The NASA–ISRO Synthetic Aperture Radar mission uses:
- L-band SAR with a wavelength of approximately 24 centimeters
- S-band SAR with a wavelength of approximately 9.4 centimeters
As of August 3, 2026, NASA lists NISAR in its science phase. NASA reports that more than 100,000 Level 1 through Level 3 L-band products were released through the Alaska Satellite Facility DAAC in late February 2026.
Current mission information is available from the official NASA NISAR mission page. Released products and coverage information are documented in the NISAR data overview.
Because mission operations and data availability can change, these details should be checked during future editorial reviews.
Why Longer Wavelengths Do Not “See Through Everything”
Longer wavelengths can interact more deeply with some dry, low-loss, or structurally open materials. That does not mean radar automatically sees through forests, buildings, soil, snow, or ice.
The interaction depends on:
- Moisture
- Electrical conductivity
- Density
- Object size
- Wavelength
- Incidence angle
- Internal layering
- Surface roughness
Accurate descriptions include:
- SAR can interact with vegetation at wavelength-dependent depths.
- Longer wavelengths may respond more strongly to branches and trunks.
- SAR can usually observe Earth’s surface through cloud cover.
- Radar does not automatically produce a clear image of everything beneath a material.
What Does SAR Polarization Mean?
Polarization describes the orientation of the transmitted electromagnetic field and the orientation measured by the receiving antenna.
The first letter identifies the transmitted polarization. The second identifies the received polarization.
| Code | Transmitted | Received | Common interpretation value |
|---|---|---|---|
| HH | Horizontal | Horizontal | Surface and double-bounce responses; useful in some forest, ice, and maritime applications |
| VV | Vertical | Vertical | Common in surface, soil, ocean, and deformation products |
| HV | Horizontal | Vertical | Sensitive to depolarizing and volume-scattering targets |
| VH | Vertical | Horizontal | Often useful for vegetation and structurally complex surfaces |
HH and VV are co-polarized channels. HV and VH are cross-polarized channels.
Cross-polarized returns are often useful where vegetation, snow grains, branches, or other complex structures change the signal orientation.
Polarization should not be interpreted in isolation. A C-band VH image collected at one incidence angle is not directly equivalent to an L-band HV image collected with another mission and geometry.
How Is SAR Used in Earth Observation?
SAR is especially valuable where clouds, darkness, difficult access, or the need for repeated observations limits ordinary optical imaging.
Flood Mapping
Calm open water frequently produces weak backscatter, making SAR useful for identifying possible inundation.
A typical analysis compares a pre-event acquisition with an event-period image. Areas that change from land-like backscatter to a smooth, low-return pattern may represent new open water.
Complications include:
- Wind-roughened water
- Flooded trees
- Urban double-bounce
- Radar shadow
- Seasonal wetlands
- Tidal variation
- Agricultural changes
- Different viewing geometry
Flooded vegetation may become brighter rather than darker because water and vertical trunks can create double-bounce scattering.
Ground Deformation
Interferometric synthetic aperture radar, or InSAR, compares phase information from two or more compatible SAR acquisitions.
Phase changes can be used to estimate changes in the distance between the ground and the radar. The primary measurement is along the radar’s line of sight, not a complete three-dimensional displacement vector.
The U.S. Geological Survey explains this process in its official InSAR overview.
Useful InSAR results depend on:
- Accurate coregistration
- Compatible viewing geometry
- Adequate coherence
- Orbit correction
- Topographic correction
- Atmospheric assessment
- Careful phase unwrapping
- A suitable reference area
A colorful interferogram is not automatic proof of ground movement. Atmospheric delay, topography, orbit error, vegetation change, and processing artifacts can also affect the pattern.
Agriculture and Soil Conditions
Radar backscatter can respond to:
- Soil moisture
- Surface roughness
- Tillage
- Crop structure
- Plant water content
- Row orientation
- Growth stage
- Flooding and drainage
- Harvest
Several variables often change simultaneously.
Stronger backscatter after rainfall may partly reflect wetter soil, but crop growth, roughness, wind, or acquisition geometry may create a similar change. A consistent time series is therefore usually more informative than one scene.
Forest Monitoring
Longer-wavelength radar can interact with branches and trunks, making SAR useful for studying:
- Forest structure
- Disturbance
- Biomass-related patterns
- Logging
- Storm damage
- Inundated vegetation
- Seasonal moisture change
The relationship between backscatter and biomass is not unlimited. At sufficiently high biomass, the signal may become less sensitive to additional material.
Slope, forest type, moisture, polarization, and wavelength also affect the response.
Snow, Glaciers, and Sea Ice
SAR can observe high-latitude and mountain regions during prolonged darkness or cloud cover.
Applications include:
- Glacier velocity
- Ice-sheet movement
- Sea-ice extent and texture
- Iceberg detection
- Wet-snow mapping
- Freeze and thaw transitions
Liquid water, snow grains, internal layers, surface roughness, and wavelength all influence the result.
Oceans and Ships
SAR can reveal patterns associated with:
- Surface winds
- Waves
- Sea ice
- Ships
- Coastal processes
- Oil slicks and other surface films
Ships often produce strong returns because of metallic structures and angular geometry.
Some surface films suppress small waves and appear darker than nearby water. A dark patch alone is not proof of an oil spill. Wind conditions, natural films, current boundaries, calm areas, and processing artifacts can create similar patterns.
Disaster and Environmental Monitoring
SAR can support the analysis of floods, earthquakes, volcanoes, landslides, ice movement, and land subsidence.
It complements rather than replaces optical imagery, field observations, gauges, GNSS measurements, or professional hazard assessment.
Professional-use limitation: SAR-derived interpretations should not be used as the sole basis for emergency response, navigation, legal boundaries, insurance decisions, or public-safety actions. High-consequence decisions require qualified analysis, explicit uncertainty, and independently validated information.
How Would a Flood-Mapping Workflow Work?
Consider a river basin where prolonged rainfall has caused flooding while cloud cover prevents useful optical imaging.
The analysis should begin with a physical question, not a brightness threshold:
Which areas that were previously dry are now likely to be inundated?
Step 1: Define the Mapping Objective
Decide whether the output needs to identify:
- Open water
- Flooded vegetation
- Urban flooding
- Maximum flood extent
- Persistent water
- Possible access disruption
These objectives do not always require the same method.
Step 2: Select Comparable Acquisitions
Choose pre-event and event images with:
- The same radar band
- The same polarization
- The same imaging mode
- The same orbit direction
- A similar incidence angle
- Comparable processing
Editorial observation: In change-detection work, acquisition consistency often matters more than obtaining the smallest advertised pixel size.
A visually sharper image may be a poorer comparison image if its viewing geometry does not match the reference acquisition.
Step 3: Choose an Appropriate Product
A radiometrically terrain-corrected product may be suitable for calibrated backscatter comparison and map-based analysis.
Single-look complex data would be required if the project needed coherent phase information.
NASA’s OPERA RTC-S1 product, for example, provides terrain-normalized Sentinel-1 backscatter on a predefined map grid.
Grid spacing should not be interpreted as proof that every object of the same size can be independently resolved.
Step 4: Identify Physically Plausible Changes
New open water may show a substantial reduction in backscatter.
Flooded vegetation or urban flooding may instead produce stronger returns when water creates double-bounce paths with trunks, walls, or other vertical structures.
Evaluate shape, terrain position, drainage context, and temporal behavior rather than classifying every dark pixel as water.
Step 5: Remove Common False Positives
Check for:
- Permanent lakes and rivers
- Radar shadow
- Smooth roads and runways
- Steep terrain
- Tidal areas
- Seasonal wetlands
- Agricultural fields with altered roughness
- Areas affected by different viewing geometry
Step 6: Assign Evidence-Based Confidence
The following confidence ladder is an editorial reasoning aid, not a formal flood-mapping standard.
| Confidence level | Evidence |
|---|---|
| Candidate | Backscatter changed in a direction consistent with possible flooding |
| Plausible | The changed area follows terrain, drainage, or floodplain geometry |
| Supported | Multiple dates, polarizations, or independent layers show a consistent pattern |
| Validated | Gauges, field reports, elevation data, or optical imagery independently support the result |
Step 7: Communicate Uncertainty
A responsible flood product distinguishes among:
- Independently supported flooding
- Probable flooding
- Possible flooding
- Areas affected by layover or shadow
- Areas without sufficient evidence
Every classified pixel should not be presented as equally certain.
Which SAR Product Type Should You Choose?
Choose the product according to whether the task requires phase information, calibrated backscatter, or a map-ready layer.
Product names vary among missions, but the following categories are common.
| Product type | Best suited to | Main advantage | Main caution |
|---|---|---|---|
| Single-look complex data | InSAR, coherent change detection, and advanced processing | Preserves amplitude and phase | Requires specialist processing and precise geometry |
| Detected ground-range data | General viewing and some backscatter analysis | Easier to display and smaller than complex data | Interferometric phase is generally unavailable |
| Radiometrically terrain-corrected data | Mapping, classification, and time-series backscatter comparison | Geocoded and normalized for important terrain effects | Layover and shadow remain missing or ambiguous observations |
| Derived thematic products | Flood, deformation, vegetation, or surface-water applications | Faster to use for a defined purpose | Reliability depends on the algorithm, assumptions, and validation |
Why Terrain Correction Cannot Recover Every Slope
Terrain correction can improve map geometry and account for important slope-related effects.
It cannot reconstruct information the radar never observed.
In radar shadow, the surface was not illuminated. In severe layover, returns from different terrain locations may overlap within one measurement.
An acquisition from another viewing direction may provide more information than additional processing of the original image.
What Are the Main Limitations of SAR?
SAR has objective technical limitations that affect how its data should be used.
Images Are Not Visually Intuitive
A bright area can represent a building, rough soil, wet ground, a radar-facing slope, flooded vegetation, or another strong scatterer.
Interpretation requires metadata and physical context.
Speckle Is Inherent to Coherent Radar Imaging
Speckle is the grainy pattern created when signals from many unresolved scatterers combine constructively and destructively.
It is not simply a dirty image or ordinary camera noise.
Multilooking, filtering, and time-series averaging can reduce its visual effect, but excessive smoothing may remove narrow roads, small water bodies, ships, or other useful features.
The Alaska Satellite Facility describes speckle and terrain geometry in its official Introduction to SAR.
Side-Looking Geometry Distorts Steep Terrain
Three common terrain effects are:
- Foreshortening: A slope facing the radar appears compressed.
- Layover: A mountaintop return arrives before the return from the lower slope.
- Radar shadow: A slope facing away from the sensor receives little or no illumination.
Terrain correction improves geometry but cannot turn layover or shadow into direct observations.
Similar Signals Can Have Different Causes
An increase in backscatter may result from:
- More moisture
- Greater roughness
- Vegetation growth
- A new viewing angle
- Different polarization
- Different processing
SAR interpretation is often a non-unique inference problem. Several physical conditions can produce similar measurements.
InSAR Coherence Can Be Lost
Interferometry requires the scattering properties of the ground to remain sufficiently stable between acquisitions.
Vegetation growth, farming, snowfall, water movement, construction, and long time intervals may reduce coherence.
Low coherence does not prove that the surface moved. It means the phase relationship is not stable enough for a reliable comparison.
The Atmosphere Is Not Irrelevant
SAR is far less obstructed by cloud than optical imaging, but “all-weather” should not be interpreted as “unaffected by the atmosphere.”
Heavy precipitation can influence some observations. Atmospheric water vapor can also introduce phase delays into precision InSAR measurements.
Resolution, Coverage, and Revisit Involve Trade-Offs
A mission may trade among:
- Spatial resolution
- Swath width
- Revisit frequency
- Polarization options
- Signal-to-noise performance
- Data volume
The product with the smallest pixels is not automatically the most useful product.
Which SAR Interpretation Mistakes Should You Avoid?
The following are analyst errors rather than unavoidable properties of the radar instrument.
Mistake 1: Treating SAR as a Black-and-White Photograph
Radar brightness represents backscatter strength, not visible brightness.
Better approach: Interpret the signal through wavelength, polarization, geometry, roughness, moisture, and target structure.
Mistake 2: Assigning a Land-Cover Label From One Pixel
One value can result from several physical conditions.
Better approach: Examine spatial patterns, neighboring terrain, multiple dates, and independent information.
Mistake 3: Comparing Incompatible Acquisitions
Ascending and descending passes view terrain from different directions. Modes and incidence angles can also change image appearance.
Better approach: Match orbit direction, mode, polarization, incidence angle, and processing level when detecting change.
Mistake 4: Confusing Pixel Spacing With Resolution
Small pixels can make an image look detailed without proving that the system resolves equally small targets.
Better approach: Check both pixel spacing and effective spatial resolution in the product documentation.
Mistake 5: Applying Excessive Speckle Filtering
Heavy smoothing can make an image look cleaner while erasing useful features.
Better approach: Select filtering strength according to the size of the targets that must be preserved.
Mistake 6: Reading an Interferogram Without Checking Coherence
Phase patterns can be influenced by deformation, atmosphere, orbit error, topography, or decorrelation.
Better approach: Review coherence, acquisition geometry, atmospheric conditions, reference areas, and independent measurements.
Mistake 7: Treating a Derived Map as Ground Truth
Flood, biomass, moisture, and deformation products are estimates produced under specific assumptions.
Better approach: Review the methodology, uncertainty, validation, and intended use of the product.
How Should You Choose SAR Data?
A useful SAR analysis begins with the physical question, not a search for the highest-resolution scene.
The SAR Data Fit Test
The following six-part framework is a practical selection tool developed for this guide. It is not an official mission or industry standard.
1. Question Fit
Define what needs to be observed:
- Open water
- Soil moisture
- Crop structure
- Forest disturbance
- Ice movement
- Ground deformation
- Ships
- General surface change
Avoid vague objectives such as “find the best SAR image.” The question should identify a physical variable or process.
2. Wavelength Fit
Ask which structures need to influence the signal.
- Shorter wavelengths often respond more strongly to smaller surface and upper-canopy features.
- Longer wavelengths may interact more strongly with branches, trunks, and larger structures.
- No wavelength guarantees a fixed penetration depth.
3. Geometry Fit
Record:
- Ascending or descending orbit
- Look direction
- Incidence angle
- Imaging mode
- Swath
- Terrain orientation
For mountain regions or directional urban structures, geometry may matter more than nominal pixel size.
4. Product Fit
Choose:
- Complex data when phase is required
- Calibrated detected data for backscatter analysis
- Terrain-corrected products for map-based comparison
- Derived products when their assumptions match the application
5. Time Fit
Confirm that the archive provides:
- Suitable dates
- A useful revisit interval
- Consistent acquisition modes
- Appropriate seasonal timing
- Enough scenes for a time series
A single image can reveal a spatial pattern. Multiple consistent observations are usually needed to separate persistent change from temporary conditions.
6. Validation Fit
Decide how the result will be checked before beginning the analysis.
Possible validation sources include:
- Field observations
- Elevation models
- Optical imagery
- Weather records
- GNSS measurements
- Stream gauges
- Land-cover maps
- Official hazard reports
- Independent scientific products
When no credible validation path exists, state the conclusion more cautiously.
Quick SAR Selection Guide
| User or task | Useful starting point | Main caution |
|---|---|---|
| Beginner learning interpretation | Terrain-corrected C-band backscatter | Do not assign meaning without checking geometry |
| Flood analyst | Matched pre-event and event acquisitions | Urban areas and flooded vegetation may not appear dark |
| Agriculture analyst | Repeated dual-polarization observations | Moisture and crop structure may change together |
| Forest analyst | L-band or complementary multi-band observations | Biomass sensitivity can become limited |
| Deformation analyst | Coregistered complex data suitable for InSAR | Coherence, atmosphere, and line-of-sight geometry matter |
| Mountain-region mapper | Terrain-corrected data plus layover and shadow masks | Some slopes contain no recoverable observation |
| Maritime analyst | Wide-swath data with suitable revisit | Wind, waves, and surface films affect interpretation |
How Can You Troubleshoot Unexpected SAR Results?
Troubleshooting should begin with the visible symptom and then check display settings, processing, geometry, and environmental conditions.
The Image Looks Extremely Grainy
Likely causes include speckle or an unsuitable display stretch.
Check whether the data are displayed as:
- Linear amplitude
- Linear power
- Calibrated backscatter
- Decibel values
Use moderate filtering or multilooking only when the resulting loss of spatial detail is acceptable.
Water Is Not Dark
Possible explanations include:
- Wind-roughened water
- Waves
- Ice
- Floating vegetation
- Flooded trees
- Urban double-bounce
- Different polarization
- Different incidence angle
Compare the area with earlier acquisitions and supporting land-cover information.
Mountain Slopes Look Compressed or Unusually Bright
The scene may contain foreshortening or layover.
Check:
- Radar look direction
- Local incidence angle
- Terrain slope
- Layover and shadow masks
- Digital elevation data
An acquisition from the opposite viewing direction may provide better coverage.
Two Dates Look Different Even Though No Change Was Expected
Confirm that both images use:
- The same orbit direction
- The same imaging mode
- The same polarization
- Similar incidence angles
- Comparable processing
- Similar seasonal and moisture conditions
The apparent difference may be geometric or environmental rather than permanent surface change.
An Interferogram Contains Broad, Smooth Patterns
Large smooth patterns can result from atmospheric delay or orbit error.
Review:
- Atmospheric conditions
- Orbit corrections
- Reference-point selection
- Topographic correction
- Coherence
- Independent ground measurements
Do not interpret the pattern as deformation until competing explanations have been considered.
The Image Does Not Align With Other Map Layers
The product may still be in radar geometry, use another coordinate system, or lack terrain correction.
Confirm:
- Coordinate reference system
- Geocoding status
- Datum
- Terrain correction
- Pixel alignment
- Resampling method
A visual offset is not necessarily a radar-detection error.
What Should You Remember About Synthetic Aperture Radar?
Synthetic aperture radar creates detailed Earth observations by combining microwave echoes collected as a radar platform moves along its path.
Its central advantage is measurement continuity: SAR does not require sunlight and can usually observe the surface through cloud cover.
Its main challenge is interpretation.
Brightness alone does not identify a material or land-cover class. Reliable analysis connects the signal to a physical question, checks acquisition geometry, compares compatible observations, and uses independent evidence.
Recommended Next Steps
- If you are new to SAR: Begin with a terrain-corrected backscatter product and learn to recognize water, cities, vegetation, slopes, shadow, and speckle.
- If you are studying floods or agriculture: Build a time series rather than relying on one scene.
- If you are studying deformation: Learn phase, coherence, coregistration, atmospheric effects, and line-of-sight geometry before interpreting an interferogram.
- If you are selecting a mission: Define the physical feature first, then choose wavelength, polarization, geometry, resolution, swath, and revisit frequency.
- If the result will support a high-consequence decision: Use qualified analysis, explicit uncertainty, and independent validation.
Frequently Asked Questions
Can synthetic aperture radar see through clouds?
SAR microwaves generally pass through cloud cover much more effectively than visible or infrared light, allowing the surface to be observed when optical imagery is blocked.
Heavy precipitation and atmospheric delays can still affect some radar observations.
Can SAR operate at night?
Yes. SAR transmits its own microwave energy and does not require sunlight.
Day and night images can be compared when their acquisition mode, geometry, polarization, and processing are compatible.
Can SAR see through forests?
SAR can interact with different parts of vegetation depending on wavelength.
Shorter wavelengths often respond more strongly to leaves and upper-canopy features. Longer wavelengths may interact more strongly with branches and trunks, but they do not provide a universally clear view of the ground.
What is the difference between SAR and InSAR?
SAR produces radar images using the amplitude and phase of returned microwave signals.
InSAR compares phase information from compatible acquisitions to estimate changes in radar-to-ground distance or, in some configurations, derive topographic information.
Why do SAR images look noisy?
The grainy appearance is usually speckle, which results from coherent interference among many scatterers within each resolution cell.
Multilooking and filtering can reduce speckle, but excessive smoothing may erase useful detail.
Is SAR difficult to use?
Map-ready products can be opened in standard geographic information system software, but reliable interpretation requires more context than true-color imagery.
Advanced applications such as InSAR, polarimetry, biomass estimation, and soil-moisture retrieval require additional processing knowledge and validation.
How This Article Was Researched and Checked
This article was prepared and editorially checked using first-party technical documentation from NASA, the European Space Agency, the U.S. Geological Survey, and the Alaska Satellite Facility.
The source review covered:
- Active radar and passive optical sensing
- Synthetic-aperture formation
- Range and azimuth geometry
- Range-resolution terminology
- Backscatter and scattering mechanisms
- Wavelength and polarization
- Terrain distortion and speckle
- InSAR assumptions and limitations
- Product-level selection
- Current NISAR mission and data status
- Practical interpretation safeguards
Definitions, radar-band ranges, product terminology, geometry, and InSAR limitations were cross-checked across multiple authoritative sources.
The bandwidth table was calculated directly from the stated idealized slant-range formula. It is an educational calculation, not measured performance from a particular satellite.
No original satellite measurements, field validation, laboratory experiments, or product performance tests were conducted for this article.
Sources
NASA Earthdata — Synthetic Aperture Radar
Official overview of synthetic apertures, radar geometry, wavelength bands, polarization, backscatter, and common applications.NASA Earthdata — NOAA SAR Marine User’s Manual, Chapter 1
Technical explanation of pulse bandwidth, range resolution, synthetic-aperture processing, and radar imaging geometry.European Space Agency — Sentinel-1 Instrument
Official description of Sentinel-1’s C-band radar, imaging modes, cloud capability, night operation, and interferometry.U.S. Geological Survey — Interferometric Synthetic Aperture Radar
Official explanation of repeat-pass interferometry, phase change, range change, and land-deformation monitoring.Alaska Satellite Facility — Introduction to SAR
Technical guidance on radar operation, roughness, scattering, speckle, foreshortening, layover, shadow, and terrain correction.NASA Earthdata — OPERA RTC-S1 Product
Official documentation for terrain-normalized Sentinel-1 backscatter products.NASA Science — NISAR Mission
Current mission phase, instrument wavelengths, objectives, and public data status.NASA Science — NISAR Data Overview
Official information about released NISAR products, coverage, data access, and supporting documentation.
More from Earth Observation & Mapping
How Do Satellites Detect Wildfires and Smoke?
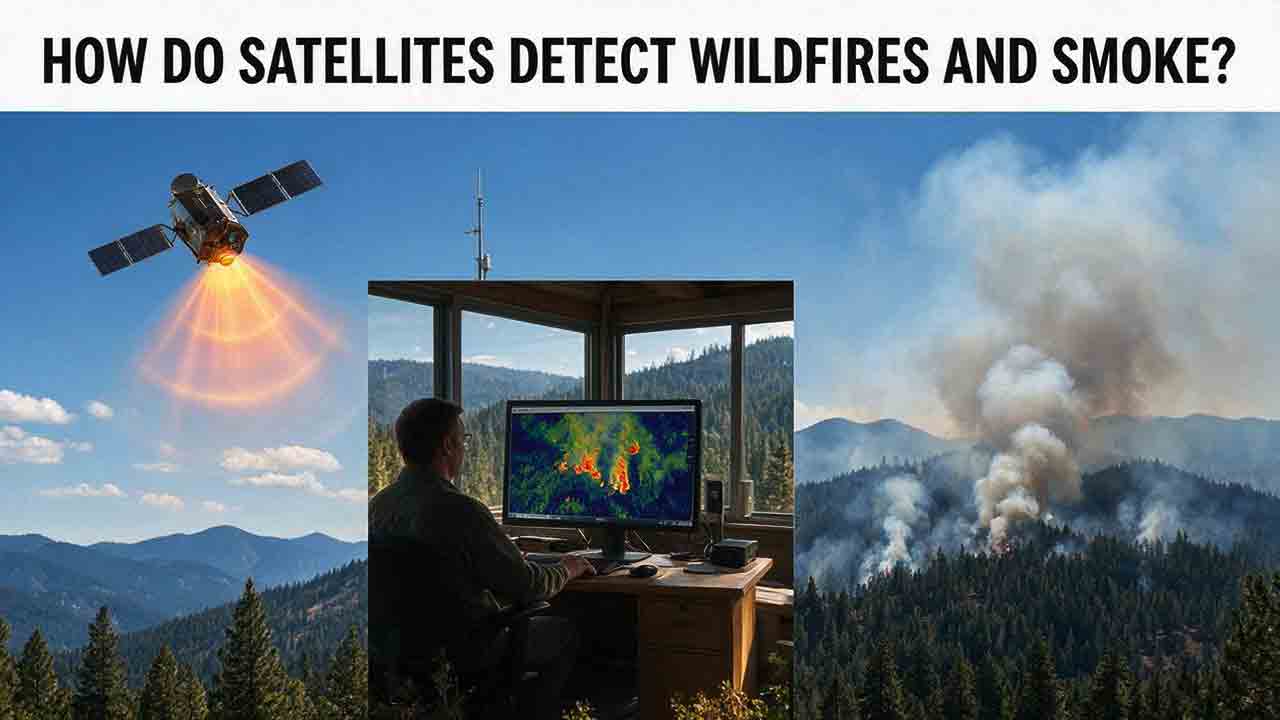
Satellites detect wildfires by measuring unusual heat in infrared wavelengths, while visible, multispectral, and aerosol observations help analysts follow smoke across the atmosphere. This guide explains how systems such as GOES, VIIRS, MODIS, Landsat, and Sentinel contribute different pieces of the wildfire-monitoring picture. Readers will learn why a thermal hotspot is not the same as an exact fire perimeter, why satellite smoke imagery cannot replace ground-level PM2.5 measurements, and how clouds, terrain, viewing geometry, and satellite overpass timing can affect detection. The article also compares commonly used fire and smoke products, explains fire radiative power and the Normalized Burn Ratio, and provides a practical framework for choosing the right map. A documented Camp Fire example shows how multiple satellite and surface datasets can complement one another. Satellite information is valuable for situational awareness, but official emergency agencies remain the appropriate source for evacuation orders, road closures, and immediate safety decisions.
How Are Satellite Images Used in Agriculture?
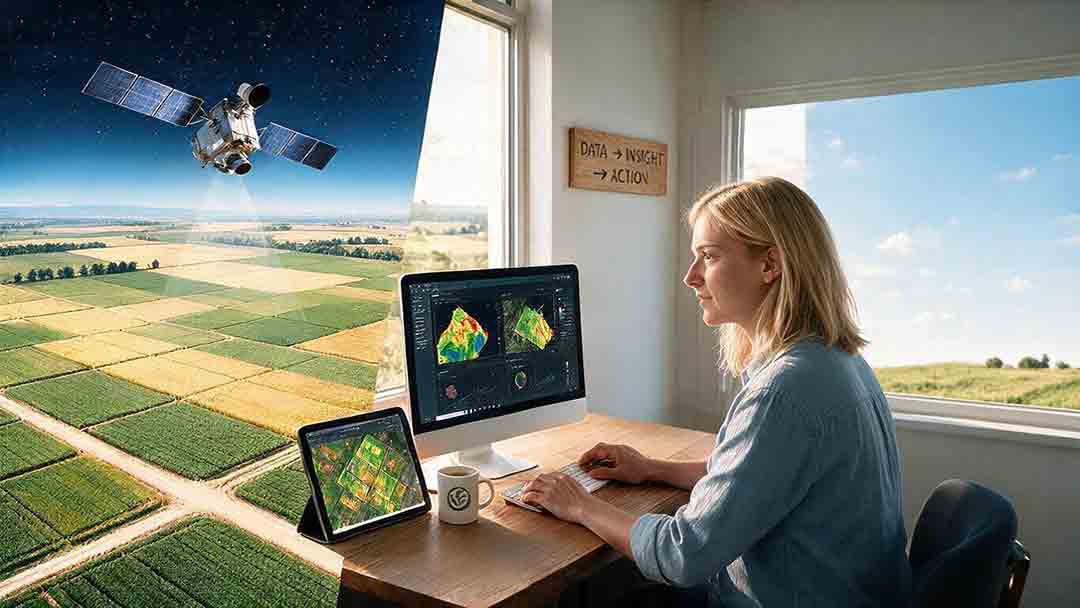
Satellite images help farmers, agronomists, researchers, insurers, and public agencies monitor agricultural land across fields, regions, and growing seasons. This guide explains how optical, radar, thermal, and microwave satellite observations support crop-development monitoring, irrigation analysis, field mapping, flood and drought assessment, crop classification, and regional production forecasting. It distinguishes what satellites directly observe from calculated indices, classification results, and modeled estimates such as evapotranspiration. Readers will also learn how NDVI works, why spatial resolution and image timing matter, and when drones or field scouting are more appropriate. The original CosmoBasics SCALE Framework provides a practical way to decide whether satellite imagery fits a specific agricultural problem. Documented examples from USDA and OpenET show how operational products combine multiple observations, reference data, weather information, and models. Throughout the guide, satellite imagery is treated as a screening and monitoring tool—not a substitute for field verification, laboratory testing, or professional agricultural judgment.

How Do Satellites Measure Changes in Earth’s Climate?
Satellites help scientists measure changes in Earth’s climate by repeatedly observing physical variables such as temperature, radiation, atmospheric gases, sea level, ice, soil moisture, vegetation, and land cover. Their instruments detect reflected sunlight, emitted heat, microwave energy, radar and laser travel time, and small changes in Earth’s gravity. These raw observations must be calibrated, corrected, validated, and combined across multiple missions before they can become reliable long-term climate records. This article explains the full path from sensor signal to scientific conclusion, including a practical sea-level measurement example. It also introduces the Signal-to-Claim Chain and the 4C Climate-Record Test, two reader frameworks for evaluating satellite datasets, maps, and climate claims by examining coverage, continuity, calibration, cross-checking, processing methods, and uncertainty.
Explore More Topics
Why Does Your Phone Sometimes Show the Wrong Location?
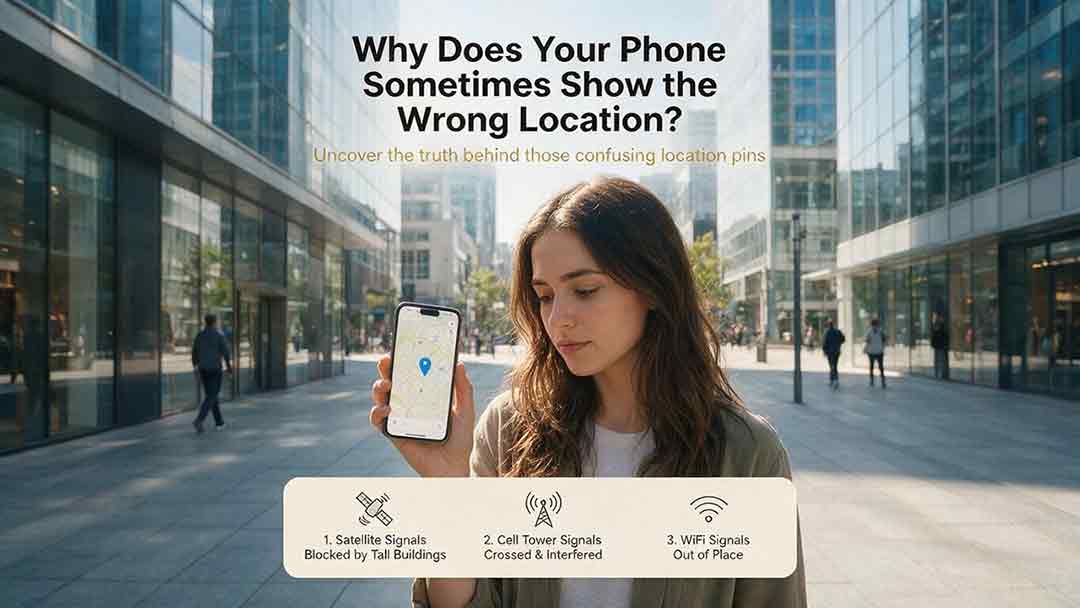
A phone’s location can appear incorrect even when its GPS hardware is functioning normally. Modern smartphones estimate position by combining satellite signals with Wi-Fi, cellular networks, Bluetooth, motion sensors, app permissions, and map data. This guide explains how blocked or reflected signals, cached locations, approximate permissions, battery restrictions, compass errors, and inaccurate map pins can affect the blue dot. It introduces two practical CosmoBasics troubleshooting tools—the Two Apps, Two Places Rule and the PLACE Test—to help readers distinguish app problems, environmental interference, stale data, mapping errors, and possible device-level issues. The article also provides step-by-step fixes for iPhone and Android, explains realistic smartphone accuracy under open-sky and indoor conditions, and identifies when contacting the manufacturer may be appropriate. All major technical claims are supported by first-party documentation from GPS.gov, Apple, Android, Google Maps, and Google for Developers.
How Accurate Is Consumer GPS?
Consumer GPS can often estimate horizontal position within about 5 meters under open sky, but actual accuracy varies significantly with the device, satellite geometry, signal blockage, reflected signals, antenna placement, and software processing. This guide explains what GPS accuracy figures really mean, why an app’s accuracy circle is not the same as measured error, and why smartphone references, Android confidence estimates, and government GPS performance standards should not be treated as interchangeable. It introduces the CosmoBasics Target Separation Test, a practical framework for deciding whether GPS uncertainty is small enough for a specific task. Readers will also learn how smartphones combine GNSS, Wi-Fi, cellular data, and sensors; how dual-frequency reception may improve performance; why altitude is less reliable than horizontal position; and how to test and troubleshoot a device. The article clearly identifies situations where consumer GPS is useful and where professional, certified, or regulated positioning methods are necessary.
GPS vs GNSS: What Is the Difference?
GPS and GNSS are often used as if they mean the same thing, but they describe different levels of satellite navigation technology. GPS is the United States’ satellite navigation system, while GNSS is the broader category that includes GPS, Galileo, GLONASS, BeiDou, and compatible regional systems such as QZSS and NavIC. This guide explains how GPS-only and multi-GNSS receivers differ, why access to more constellations may improve signal availability, and why a larger satellite count does not automatically guarantee greater accuracy. It also examines dual-frequency reception, satellite geometry, antenna quality, correction services, sensor integration, and common positioning errors. Readers can use the Receiver Capability Stack, buying checklist, real-world examples, and troubleshooting steps to evaluate phones, watches, vehicle navigators, outdoor devices, survey receivers, and timing systems. The article is based on official technical documentation and clearly distinguishes educational examples from recognized GNSS performance standards.