How Are Satellite Images Used in Agriculture?

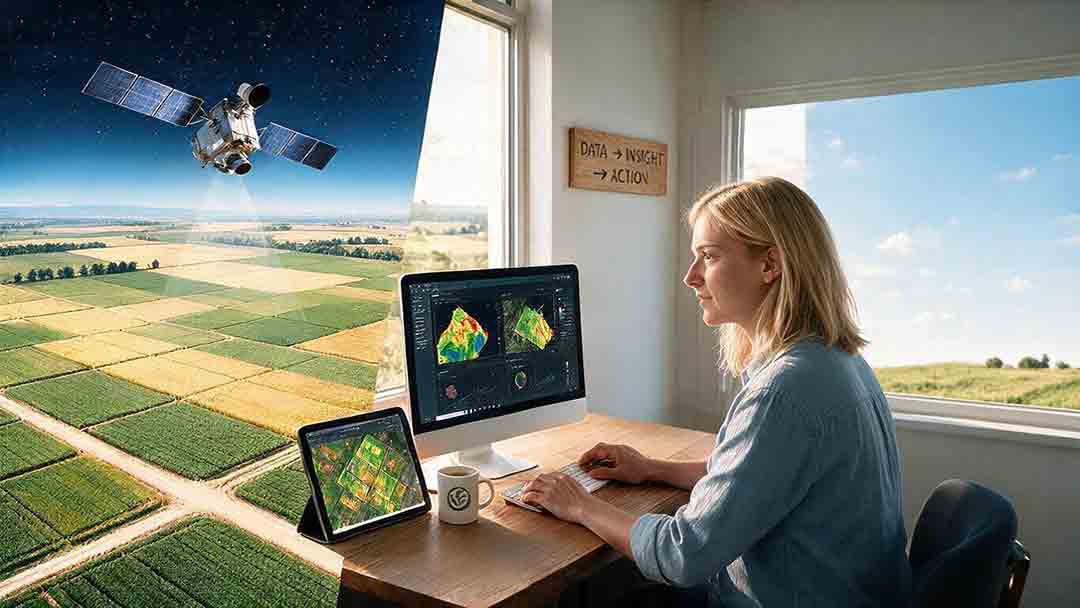
Satellite images are used in agriculture to map fields, monitor crop development, reveal unusual vegetation or moisture patterns, estimate crop water use, classify planted areas, document weather damage, and support regional production forecasts. Their greatest value is not diagnosing a problem from space, but showing where and when conditions differ so people can investigate more efficiently.
Key Takeaways
- Satellite imagery helps locate and track differences across fields and growing seasons.
- Optical, radar, and thermal sensors provide different—not interchangeable—information.
- NDVI and similar products are calculated indicators, not direct crop diagnoses.
- Resolution, acquisition timing, cloud cover, crop stage, and field size determine whether imagery is useful.
- Important agricultural decisions should combine satellite evidence with field observations and other records.
This guide explains what agricultural satellites actually observe, which common products are calculated or modeled, and how those products can support practical decisions. It also includes an original decision framework, a field-pixel calculation, a tool-selection guide, and two documented examples of operational agricultural remote sensing.
Agricultural satellite imagery is best understood as a screening and monitoring tool. It shows where and when surface conditions differ, but usually cannot explain the cause without additional evidence.
How Satellite Images Support Agricultural Decisions
Agricultural remote sensing is the collection of information about crops, soil, water, and land without making direct physical contact with them.
Satellite sensors record reflected light, emitted thermal energy, or returned microwave signals. Those observations can then be calibrated, combined, classified, or entered into models to create agricultural information products.
In practice, satellite imagery usually helps answer one of three questions:
- Where should someone inspect?
- Which areas may require different management?
- How have conditions changed over time?
NASA identifies surface reflectance, vegetation greenness, land temperature, soil moisture, rainfall, crop extent, and drought conditions among the Earth-observation variables used in agriculture. Some are sensor-derived observations; others are calculated or modeled from several inputs.
See NASA Earthdata’s agriculture production resources.
Common Agricultural Applications
| Application | What satellite data can contribute | Decision supported |
|---|---|---|
| Crop development monitoring | Changes in canopy reflectance over time | Where growth differs from the expected pattern |
| Irrigation analysis | Vegetation, temperature, and estimated water-use patterns | Which zones deserve inspection |
| Crop classification | Seasonal spectral and structural signatures | What crops are likely planted and where |
| Field mapping | Boundaries, cultivated area, water, soil, and land-cover change | Inventory, planning, and reporting |
| Storm or flood assessment | Before-and-after surface changes | Where damage inspections should begin |
| Drought monitoring | Vegetation, rainfall, temperature, and moisture anomalies | Which regions show worsening conditions |
| Sampling-zone design | Persistent within-field differences | Where to collect soil or plant samples |
| Production forecasting | Crop area and seasonal development combined with other data | Regional supply estimates |
Yield and production forecasts are estimates, not guarantees. They may combine satellite data with planted-area records, weather, statistical methods, and crop models. Extreme weather, unusual management, incomplete reference data, and changing field conditions can increase uncertainty.
What Satellites Observe—and What Software Infers
A map shown in an agricultural platform is not necessarily a direct measurement.
Satellite instruments record electromagnetic energy. Many familiar agricultural products are created later through equations, retrieval algorithms, classifications, or models.
Measured and Derived Agricultural Information
| Product | Information type | Practical meaning |
|---|---|---|
| Red reflectance | Sensor-derived observation | Processed estimate of reflected energy in the red band |
| Near-infrared reflectance | Sensor-derived observation | Spectral response influenced by vegetation structure and other surfaces |
| Radar backscatter | Sensor-derived microwave response | Signal influenced by moisture, roughness, structure, and viewing geometry |
| Land-surface temperature | Retrieved geophysical product | Temperature derived from thermal observations and processing assumptions |
| NDVI | Calculated spectral index | Ratio derived from red and near-infrared reflectance |
| Crop type | Classification result | Algorithmic label based on imagery and reference data |
| Evapotranspiration | Modeled estimate | Calculation combining satellite and meteorological inputs |
| Yield forecast | Statistical or crop-model estimate | Prediction with assumptions and uncertainty |
| Crop health score | Platform-specific interpretation | Provider-defined score that may differ between services |
| Soil moisture | Product-dependent information | May be sensor-derived, modeled, assimilated, or downscaled |
A product can be useful without being a direct measurement. The important questions are:
- How was it produced?
- What resolution does it have?
- How current is it?
- What uncertainty or quality information is available?
- Was it designed for the decision being made?
Evapotranspiration is a clear example. NASA explains that evapotranspiration cannot be measured directly by a satellite instrument. It is estimated using variables such as land-surface temperature, air temperature, solar radiation, vegetation information, and meteorological data.
See NASA Earthdata’s evapotranspiration overview.
Which Satellite Sensors Are Used in Agriculture?
Agricultural remote sensing commonly uses optical multispectral imagery, synthetic aperture radar, thermal infrared observations, and broader-scale microwave products.
Each data type responds to different physical properties. A sensor that is useful for tracking canopy development may not be the best choice for flood mapping, regional soil-moisture monitoring, or field-scale water-use estimates.
Optical and Multispectral Imagery
Optical satellites measure sunlight reflected from Earth in visible and invisible wavelength bands.
Healthy green vegetation generally absorbs much of the visible red light used in photosynthesis. Internal leaf structure reflects more near-infrared energy, creating a spectral contrast that can be used to study vegetation.
Red-edge and shortwave-infrared bands can add information related to canopy development, leaf water content, soil, crop residue, and surface moisture patterns.
The Sentinel-2 Multispectral Instrument records 13 spectral bands:
- Four bands at 10 m resolution
- Six bands at 20 m resolution
- Three atmospheric bands at 60 m resolution
Not every Sentinel-2 band is available at 10 m. The effective detail of an agricultural product therefore depends on the bands used and whether any bands were resampled during processing.
ESA lists agriculture, land-cover monitoring, leaf-area analysis, chlorophyll-related variables, and leaf-water-content mapping among Sentinel-2 applications.
See ESA’s official Sentinel-2 facts and figures.
Landsat 8 carries the Operational Land Imager and the Thermal Infrared Sensor. Its standard optical bands have 30 m spatial resolution, while the panchromatic band has 15 m resolution. The thermal bands have a coarser native resolution and may be resampled in distributed products.
Each Landsat 8 or Landsat 9 satellite passes over the same location on a 16-day cycle. Their orbits are offset, creating a combined opportunity approximately every eight days.
That schedule does not guarantee a clear, usable agricultural observation every eight days. Clouds, haze, acquisition planning, shadows, and processing delays may reduce actual availability.
See:
Optical imagery is especially useful for:
- Comparing crop development among fields
- Tracking planting, growth, senescence, and harvest
- Calculating vegetation indices
- Mapping soil, water, residue, and vegetation
- Supporting crop classification
- Identifying locations that deserve scouting
Its main limitation is obstruction by clouds, haze, smoke, and shadows.
Synthetic Aperture Radar
Synthetic aperture radar, or SAR, transmits microwave energy toward Earth and measures the returned signal.
Radar does not require sunlight and is generally much less affected by ordinary cloud cover than optical imagery. Its returned signal, called backscatter, can change with:
- Surface roughness
- Soil moisture
- Crop structure
- Vegetation water content
- Polarization
- Incidence angle
- Recent field operations
Agricultural radar applications include:
- Flood and standing-water mapping
- Monitoring during cloudy periods
- Crop-structure analysis
- Crop classification
- Tillage and harvest-event detection
- Tracking larger moisture-related changes
ESA has demonstrated how Sentinel-1 radar time series and interferometric coherence can contribute to crop-type classification.
See ESA’s Sentinel-1 crop-mapping example.
Radar should not be described as unaffected by weather or as a direct measurement of crop moisture. Strong precipitation, soil conditions, surface roughness, crop structure, and acquisition geometry can all influence the signal.
Thermal Infrared Observations
Thermal sensors detect emitted energy rather than reflected sunlight. Processing converts that signal into a land-surface-temperature product.
Plants can cool their leaves through transpiration. When water becomes limited, stomata may close and canopy temperature can rise. However, temperature is also affected by:
- Air temperature
- Wind
- Humidity
- Soil exposure
- Canopy density
- Irrigation timing
- Acquisition time
- Cloud conditions
Thermal information can contribute to:
- Water-stress screening
- Evapotranspiration modeling
- Irrigation-zone comparison
- Drought analysis
- Surface-temperature mapping
A thermal satellite product should not automatically be described as the exact temperature of a crop canopy. More accurate terms include:
- Retrieved land-surface temperature
- Thermal observation
- Processed temperature product
- Satellite-derived surface-temperature estimate
Thermal sensors do not depend on reflected sunlight in the same way as optical sensors, but clouds can still prevent useful surface observations. Daytime and nighttime temperature products also should not be compared without accounting for acquisition conditions.
Passive Microwave and Soil-Moisture Products
Passive microwave instruments detect naturally emitted microwave energy associated with soil moisture and other surface properties.
NASA’s Soil Moisture Active Passive mission, or SMAP, provides global observations of surface soil moisture and freeze-thaw conditions. Other products combine remote sensing with land-surface models to estimate surface or root-zone moisture.
See:
These products can support:
- Regional drought monitoring
- Weather and hydrological modeling
- Watershed analysis
- Soil-moisture anomaly tracking
- Large-scale agricultural condition reporting
Many global soil-moisture products have pixels much larger than a single field. They can provide regional context without being suitable for deciding how much water one small field or irrigation zone needs.
Sensor Comparison
| Sensor type | Strongest agricultural role | Main limitation |
|---|---|---|
| Optical multispectral | Vegetation, crop development, and land cover | Clouds and shadows |
| Synthetic aperture radar | Floods, structure, and cloudy-season monitoring | Complex, context-dependent interpretation |
| Thermal infrared | Surface temperature and modeled crop water use | Temperature differences have several possible causes |
| Passive microwave | Regional soil moisture and drought context | Often too coarse for field-level decisions |
Using Vegetation Indices Responsibly
Vegetation indices combine spectral bands mathematically to emphasize selected surface characteristics.
They can make vegetation patterns easier to compare, but no index removes every influence from soil background, atmosphere, illumination, canopy structure, or sensor geometry.
What NDVI Shows
The Normalized Difference Vegetation Index compares near-infrared and red reflectance:
NDVI = (NIR − Red) ÷ (NIR + Red)
In words, NDVI subtracts red reflectance from near-infrared reflectance and divides the result by their sum.
See NASA Earthdata’s NDVI explanation.
NDVI can help compare relative vegetation greenness and canopy development. It is not a universal crop-health score.
A value that is normal for one crop, field, soil type, date, or growth stage may be unusual in another setting.
NDVI Calculation Example
Assume one crop pixel has:
- Near-infrared reflectance: 0.50
- Red reflectance: 0.10
The calculation is:
NDVI = (0.50 − 0.10) ÷ (0.50 + 0.10)
NDVI = 0.40 ÷ 0.60
NDVI = 0.67
An NDVI of 0.67 may correspond to a dense green canopy under many conditions. It does not prove that the crop is disease-free, adequately irrigated, or likely to produce a specific yield.
The result becomes more useful when compared with:
- Other zones in the same field
- Previous dates from the same season
- Similar crops at similar growth stages
- Historical imagery from comparable seasons
- Irrigation and weather records
- Field observations
The spatial pattern and trend usually matter more than one isolated value.
Choosing an Indicator
| Indicator | Most useful for | Main caution |
|---|---|---|
| NDVI | General vegetation and canopy development | Can become less sensitive in dense vegetation |
| NDRE | Chlorophyll-related differences later in canopy development | Requires red-edge data |
| SAVI | Sparse vegetation where soil background is influential | Includes an adjustment factor |
| NDMI | Relative canopy moisture patterns | Does not directly measure root-zone soil water |
| Surface temperature | Thermal comparison and water-stress screening | Strongly affected by weather and exposed soil |
| Radar backscatter | Structural and moisture-related surface changes | Sensitive to geometry, roughness, and crop structure |
Choose an indicator because it has a defensible relationship with the management question—not because it creates the most dramatic map.
Agricultural Satellite Monitoring Workflow
A useful workflow begins with a decision, not with downloading an image.
1. Define the Decision
State what action the information could change.
Useful questions include:
- Which irrigation zones should be inspected?
- Where should soil or plant samples be collected?
- Did flooding affect the whole field or only lower areas?
- Is one field developing differently from comparable fields?
- Which areas appear to have been harvested?
“Monitor crop health” is too broad unless the response to an unusual pattern is also defined.
2. Check the Field Boundary
The mapped field should exclude roads, drainage channels, buildings, tree lines, neighboring crops, and unrelated bare soil where possible.
Boundary errors can create mixed pixels and misleading edge patterns.
3. Match the Sensor to the Question
Use:
- Optical imagery for canopy development and spectral differences
- Radar for flooding, structure, and cloudy periods
- Thermal and evapotranspiration products for water-use analysis
- Regional soil-moisture products for drought context
- Drones or direct inspection for very small features
4. Inspect Image Quality
Before interpreting a map, check:
- Acquisition date
- Cloud and shadow masks
- Missing data
- Processing level
- Field coverage
- Recent rain or irrigation
- Planting, spraying, tillage, or harvest records
- Whether the crop stage makes the comparison meaningful
5. Compare Several Dates
One image shows a moment. A time series shows whether a pattern is persistent, developing, or temporary.
Persistent zones may relate to soil, drainage, elevation, salinity, or infrastructure. A new anomaly may reflect weather, equipment failure, crop damage, field operations, or a processing error.
6. Inspect Normal and Unusual Areas
Visit at least one unusual location and one apparently normal comparison area.
Record crop stage, visible symptoms, soil condition, irrigation status, photographs, weeds, and recent operations. This reduces confirmation bias.
7. Take a Proportionate Action
A satellite anomaly may justify scouting, sampling, checking irrigation pressure, inspecting drainage, or reviewing application records.
It does not automatically justify applying more water, fertilizer, or crop-protection products.
8. Review the Outcome
After an inspection or intervention, compare later imagery and field observations.
A monitoring system is valuable only when it improves the timing, location, or confidence of a real decision.
CosmoBasics editorial observation: The operational value of an agricultural map depends less on how sophisticated the algorithm appears and more on whether the user has a defined response when an alert occurs.
The CosmoBasics SCALE Framework
The CosmoBasics SCALE Framework for Agricultural Satellite Decisions is an editorial decision tool created for this guide.
It is not a statistically validated agronomic model, diagnostic system, or substitute for a qualified agricultural adviser. It is intended to help readers judge whether satellite imagery is a reasonable first tool for a specific problem.
Use SCALE before purchasing a platform, downloading imagery, or acting on an agricultural alert.
S — Specify the Decision
Identify the action the information may change.
“Find irrigation blocks requiring inspection” is specific. “Understand the farm better” is not.
C — Check the Spatial Fit
Ask whether the feature is large enough to influence several pixels.
An individual plant, blocked nozzle, narrow leak, or small patch may be invisible in moderate-resolution imagery.
A — Assess Availability and Timing
Determine whether usable data can arrive before the decision deadline.
Cloud cover, acquisition schedules, processing delays, and data gaps can make a theoretically suitable sensor operationally unsuitable.
L — Link the Signal to the Condition
Explain why the suspected condition should affect reflectance, temperature, radar backscatter, or another observable variable.
Without a plausible physical relationship, the map may be visually impressive but operationally weak.
E — Evaluate With Ground Evidence
Decide how the interpretation will be checked.
Possible evidence includes:
- Field scouting
- Soil testing
- Plant tissue testing
- Irrigation logs
- Weather records
- Photographs
- Yield maps
- Machinery records
SCALE Practical Fit Checklist
| SCALE question | Yes | No or unsure |
|---|---|---|
| Is the management decision clearly defined? | 1 | 0 |
| Does the target feature cover several pixels? | 1 | 0 |
| Can usable data arrive before the deadline? | 1 | 0 |
| Should the condition affect an observable signal? | 1 | 0 |
| Is ground verification possible? | 1 | 0 |
Interpreting the Checklist
- 4–5 “Yes” answers: Satellite imagery is usually a strong candidate for screening or monitoring.
- 2–3 “Yes” answers: Satellite imagery may contribute, but it should not independently determine the action.
- 0–1 “Yes” answers: Direct inspection, machinery data, field sensors, aircraft, or drones may be a better starting point.
The result indicates practical fit, not scientific certainty. It should not be used as an agricultural prescription, insurance rule, or proof of a field condition.
How Spatial Resolution Changes What You Can See
Spatial resolution describes the ground dimensions represented by one pixel.
Smaller pixels can reveal finer patterns, but smaller does not automatically mean more accurate. Spectral bands, image quality, atmospheric correction, acquisition timing, crop stage, and interpretation remain important.
Field-Pixel Calculation
Suppose a field covers 5 hectares.
One hectare equals 10,000 m²:
5 hectares × 10,000 m² = 50,000 m²
A 10 m × 10 m pixel covers:
10 m × 10 m = 100 m²
The field therefore contains approximately:
50,000 m² ÷ 100 m² = 500 nominal 10 m pixels
A 30 m × 30 m pixel covers:
30 m × 30 m = 900 m²
At 30 m resolution, the field contains approximately:
50,000 m² ÷ 900 m² = 56 nominal 30 m pixels
These are idealized counts. Boundary pixels may contain a mixture of crop, road, water, trees, soil, or neighboring land.
A large rectangular grain field may be represented adequately by 10 m or 30 m imagery. A narrow vineyard, irregular vegetable plot, orchard edge, or terraced field may contain a much larger proportion of mixed pixels.
The most useful resolution is the one that matches the management unit—not necessarily the smallest pixel advertised by a provider.
Which Tool Should Be Used First?
The best first tool is not always the one with the highest resolution. It is the tool that can answer the question at the required scale, time, and cost.
| Agricultural problem | Recommended first tool | Why |
|---|---|---|
| Regional drought pattern | Satellite drought and vegetation products | Broad, repeatable coverage |
| Flooding during cloud cover | Radar satellite imagery | Microwave observations are less obstructed by clouds |
| Seasonal crop-development comparison | Optical satellite time series | Consistent multi-date reflectance |
| Exact disease diagnosis | Field scouting and laboratory testing | Diagnosis requires direct evidence |
| Small broken sprinkler | Direct inspection or drone imagery | The feature may be smaller than satellite pixels |
| Field-scale crop water-use estimate | ET product, weather data, and farm records | Water use is modeled from several inputs |
| Individual plant symptoms | Direct scouting | Individual plants are usually below satellite resolution |
| Large storm-damage footprint | Pre-event and post-event satellite imagery | Efficient area-wide comparison |
| Fine within-row variability | Drone, machinery, or close-range sensing | Greater spatial detail |
| National crop-area estimate | Satellite classification plus reference data | Scalable mapping across large regions |
A productive evidence chain is often:
Satellite screening → targeted inspection → sampling or diagnosis → documented action
Agricultural Satellite Programs in Practice
Operational agricultural products usually combine several images, reference data, quality controls, and models. They are rarely created from one picture.
USDA Cropland Data Layer
The U.S. Department of Agriculture’s National Agricultural Statistics Service produces the annual Cropland Data Layer, a crop-specific land-cover classification.
The 2025 Cropland Data Layer:
- Has 10 m spatial resolution
- Uses harmonized Sentinel-2, Landsat 8, and Landsat 9 surface-reflectance inputs
- Uses cloud-masked 10-day median composites
- Incorporates NDVI and several spectral bands
- Uses agricultural reference data and additional land-cover inputs
See:
The product illustrates several important principles:
- Crop maps depend on multiple dates rather than one image.
- Reference data are needed to train and evaluate classifications.
- A crop label remains an algorithmic classification.
- Resolution alone does not describe product quality.
- Metadata and accuracy information are essential for interpretation.
USDA states that farmer-reported information cannot be derived from the public Cropland Data Layer.
The 2025 product is used here as a documented processing example. A newer annual layer may become available after this article’s review date.
OpenET and Agricultural Water Use
OpenET combines Landsat observations with an ensemble of models to estimate evapotranspiration.
Inputs include information related to:
- Land-surface temperature
- Vegetation greenness
- Weather conditions
- Solar energy
- Model assumptions
See NASA’s explanation of how OpenET uses Landsat data.
OpenET is a useful example of why processing levels matter. A temperature product, vegetation index, and evapotranspiration estimate may appear in the same platform, but they represent different types of information and uncertainty.
An evapotranspiration layer should be described as:
- Estimated evapotranspiration
- Modeled evapotranspiration
- A satellite-informed ET estimate
It should not be described as an exact, direct measurement of irrigation demand.
Illustrative Irrigation Scenario
The following scenario is hypothetical. It is not a documented farm trial and does not claim measured water or yield savings.
A manager sees a new low-NDVI strip across part of an irrigated maize field.
Instead of assuming that the crop needs more water, the manager:
- Checks the image date and cloud mask.
- Confirms that the strip covers several pixels.
- Compares the pattern with earlier images.
- Reviews rainfall and irrigation records.
- Checks a thermal or estimated-ET product.
- Visits the strip and a normal comparison zone.
- Inspects crop stage, soil moisture, irrigation pressure, weeds, and drainage.
- Records the verified cause before changing irrigation.
The map creates value by narrowing the inspection area. It does not determine the cause.
Can Satellites Detect Disease, Pests, or Nutrient Problems?
Satellite imagery can identify areas showing patterns consistent with plant stress. It usually cannot determine the exact cause without additional evidence.
Disease, insects, nutrient deficiency, drought, excess water, compaction, salinity, weeds, frost, lodging, poor emergence, and natural senescence can produce overlapping spectral or thermal changes.
Satellite observations may help answer:
- Where did an unusual pattern appear?
- How large is the affected zone?
- When did the change become visible?
- Is the pattern expanding?
- Does it align with irrigation, soil, drainage, or management boundaries?
They usually cannot answer independently:
- Which pathogen is present?
- Which insect caused the damage?
- Which nutrient is deficient?
- Which treatment should be applied?
- Whether a particular input is legally or agronomically appropriate?
Conditions That Affect Stress Detection
| More favorable | Less favorable |
|---|---|
| The affected area covers several pixels | Only individual plants are affected |
| The canopy changes consistently | Symptoms remain below the canopy |
| Clear observations are available at the right time | Clouds block the critical period |
| Comparable historical imagery exists | No seasonal baseline exists |
| The anomaly persists across several dates | It appears once in a poor-quality image |
| Ground verification is possible | The field cannot be inspected |
Satellite imagery can prioritize scouting. It should not replace diagnosis.
Common Interpretation Errors
Treating Map Color as Severity
Agricultural platforms often stretch colors to make small numerical differences visible.
A red area does not automatically indicate severe crop damage. Check the legend, numeric range, date, quality information, and comparison method.
Applying One NDVI Threshold Everywhere
NDVI changes with crop type, growth stage, soil background, canopy density, illumination, and processing.
A threshold copied from another crop or region can create false alarms. Compare similar crops at similar stages whenever possible.
Ignoring Clouds and Processing Artifacts
Thin clouds, haze, shadows, missing data, and tile boundaries can create convincing false patterns.
Check the quality layer and original scene before treating an unusual shape as a field condition.
Assuming Higher Resolution Means Higher Reliability
Fine pixels can show smaller features, but poor timing or inconsistent processing can make them less useful than a reliable moderate-resolution time series.
Resolution is one part of data quality—not a substitute for it.
Acting Before Verifying the Cause
A low-index zone may result from insufficient water, excess water, late planting, weeds, soil variation, harvest, shadow, or a cloud-mask error.
Applying water, fertilizer, or crop-protection products based only on a color map can waste resources or worsen the real problem.
Comparing Different Growth Stages
Later planting, replanting, uneven maturity, and different crop varieties can create legitimate differences between fields.
A valid comparison requires crop-stage and management context.
Treating a Health Score as a Diagnosis
A crop health score is usually defined by the platform producing it.
Before relying on a score, determine:
- Which sensor was used
- When the image was acquired
- Which bands or indices were included
- Whether the score is relative or absolute
- How clouds and missing data were handled
- Whether the method is documented
- Whether uncertainty is shown
Scores from different platforms should not be assumed to be equivalent.
Troubleshooting Agricultural Satellite Maps
| What appears on the map | Possible explanation | What to check |
|---|---|---|
| Sharp rectangular anomaly | Tile edge, missing data, or processing artifact | Original scene and quality mask |
| Weak values around all field edges | Mixed pixels containing non-crop surfaces | Boundary accuracy and inward buffering |
| Sudden whole-field change | Growth, harvest, atmosphere, weather, or processing | Field records and nearby comparison fields |
| Known small problem is invisible | Feature is below the pixel size | Drone imagery or direct inspection |
| Radar values change unexpectedly | Moisture, roughness, crop structure, or geometry changed | Longer radar time series |
| Hot zone appears after irrigation | Bare soil, sparse canopy, timing, or weather dominates | Canopy cover and acquisition time |
| Two platforms disagree | Different sensors, dates, corrections, or formulas | Product documentation and metadata |
| Imagery looks healthy but yield was poor | Stress was temporary, hidden, late, or unrelated to greenness | Yield, weather, soil, and management records |
A single unexplained map should be treated as a question, not an answer.
Agricultural Satellite Platform Evaluation
A useful platform should explain where its data came from, when the image was collected, and how the displayed product was created.
Data Transparency Checklist
Before subscribing or relying on alerts, confirm that the platform provides:
- Satellite or data-source name
- Image-acquisition date
- Spatial resolution
- Cloud and shadow information
- Processing level
- Index formula or product definition
- Historical image access
- Correctable field boundaries
- Downloadable values or legends
- Documentation for model-derived products
- Processing-delay information
- Quality flags or uncertainty information
- Export options compatible with the farm workflow
- A review step before an alert becomes an action
Privacy and Data Ownership
Farm boundaries, yields, crop records, and management histories can have commercial value.
Before uploading data, review:
- Who owns the uploaded field information
- Whether the provider may share it
- Whether it may be used to train models
- Whether users can delete historical records
- Whether information may be supplied to insurers, suppliers, or other third parties
- What happens to stored data after account closure
- Whether exported records remain usable after cancellation
- Which law and jurisdiction govern the agreement
This is a practical contract-review checklist, not legal advice. Material agreements should be reviewed under the laws and contractual rules applicable to the farm and service provider.
Warning Signs
Be cautious when a service promises:
- Guaranteed yield increases
- Perfect irrigation recommendations
- Automatic disease diagnosis
- Real-time imagery without explaining delays
- Unlimited or near-perfect accuracy
- Input recommendations without field context
- A health score with no methodology
- Crop diagnosis without ground verification
- Commercial superiority without a documented comparison
No satellite platform should be treated as an automatic agronomic authority.
Benefits and Limitations of Agricultural Satellite Imagery
Core Benefits
- Repeated coverage over large areas
- Consistent comparison among fields
- Historical archives for seasonal analysis
- Spectral information beyond normal vision
- Faster prioritization of scouting and sampling
- Support for crop classification and damage assessment
- Public access to major Landsat and Sentinel datasets
Landsat archive products have been available for download without data charges since 2008.
Copernicus Sentinel data are available through the Copernicus Data Space Ecosystem, which provides free access to Sentinel data and related discovery, viewing, download, and processing services.
Core Limitations
- Clouds and shadows obstruct optical imagery
- Pixels may contain several surface types
- Different problems can create similar signals
- Small or rapidly developing problems may be missed
- Model outputs contain assumptions and uncertainty
- Image availability may not match the decision deadline
- Ground evidence remains necessary
Satellite information is most valuable when it reduces the area that must be inspected or improves the timing of an investigation.
Recommendations for Different Users
Small Farms and First-Time Users
Begin with one field and one management question. Review several dates before paying for complex alerts or automation.
Do not judge a field from one image or assume that a software score explains the cause of an anomaly.
Large Farms and Agricultural Enterprises
Combine satellite time series with field boundaries, crop records, weather, machinery data, and a documented inspection process.
Automated alerts are useful only when each alert leads to a defined verification step.
Irrigation Managers
Prioritize estimated evapotranspiration, thermal information, weather, water-delivery records, and soil measurements.
Do not convert NDVI directly into an irrigation volume without a locally validated method.
Agronomists and Crop Consultants
Use imagery to choose representative sampling locations and determine when a pattern first appeared.
Do not replace field judgment with a universal vegetation-index threshold.
Insurers and Damage Assessors
Use pre-event and post-event imagery with weather records, photographs, field reports, and applicable policy requirements.
Satellite imagery can help document the extent of an event, but it should not independently determine claim eligibility or payment.
Researchers and Public Agencies
Use reproducible products with documented processing, quality flags, reference data, and uncertainty analysis.
Long-term Landsat and Sentinel archives are valuable because their documentation allows methods to be examined and repeated.
How This Article Was Researched and Reviewed
This article was prepared from publicly available first-party documentation rather than commercial marketing materials.
The review included:
- Checking Sentinel-2 band and resolution information against ESA documentation
- Checking Landsat 8 and Landsat 9 resolution and acquisition schedules against USGS documentation
- Checking agricultural applications against NASA Earthdata and NASA Science resources
- Checking the 2025 Cropland Data Layer against USDA NASS metadata
- Distinguishing sensor-derived observations from indices, classifications, and model estimates
- Treating evapotranspiration as a modeled estimate rather than a direct satellite measurement
- Labeling the irrigation scenario as hypothetical
- Avoiding claims that satellite imagery can independently diagnose crop disease or guarantee agricultural outcomes
No commercial agricultural platform was independently tested or ranked for this article. No independent agronomist, agricultural engineer, or remote-sensing scientist is presented as having reviewed it.
Mission status, data portals, and product methods can change. The technical statements and official links in this article were checked on August 2, 2026.
A Practical Starting Point
Begin with one field and one management question.
Select imagery whose resolution and timing fit that question. Review several dates, inspect the quality information, and compare both unusual and normal areas before taking action.
For regional monitoring, crop mapping, flood assessment, and seasonal comparisons, satellite data may be an efficient starting point. For individual plants, small equipment failures, urgent diagnosis, or within-row detail, direct inspection or finer-scale sensing is usually more appropriate.
Use satellite images to locate and track differences, then use field evidence to explain those differences before taking action.
Frequently Asked Questions
Can satellites see individual crop plants?
Most freely available agricultural satellite products cannot resolve individual plants.
A 10 m pixel covers 100 m², while a 30 m pixel covers 900 m². Commercial satellites, aircraft, and drones may provide finer detail, but visibility still depends on plant spacing, image quality, canopy structure, and the surrounding surface.
How often are agricultural satellite images updated?
Update frequency depends on the mission, location, sensor, processing system, and cloud conditions.
A revisit schedule describes when a satellite may have an opportunity to observe an area. It does not guarantee a usable image. Optical observations may be unavailable for extended periods in cloudy regions, while radar can provide additional coverage.
Can satellite images identify a specific crop disease?
Satellite imagery can reveal areas that may require disease scouting, but it usually cannot identify a specific pathogen.
Water stress, nutrient problems, insects, weeds, soil variation, frost, and disease can produce similar spectral or thermal patterns. Diagnosis requires field evidence and may require laboratory testing.
Are agricultural satellite images free?
Many major public datasets are available without imagery charges.
Landsat products can be downloaded through USGS services, and Sentinel data can be accessed through the Copernicus Data Space Ecosystem. Commercial platforms may charge for processing, alerts, storage, integrations, support, or proprietary imagery.
Can radar satellites monitor fields through clouds?
Radar is generally much less affected by ordinary cloud cover than optical imagery and does not require sunlight.
Radar backscatter is still influenced by soil moisture, surface roughness, crop structure, acquisition geometry, polarization, and sometimes precipitation. Radar maps therefore require contextual interpretation.
Can satellite images replace crop scouting or soil tests?
No.
Satellite imagery provides broad, repeated evidence of surface and canopy patterns. Scouting, soil tests, tissue tests, equipment inspections, and farm records provide the direct evidence needed to identify causes and select appropriate actions.
Sources
Accessed August 2, 2026.
NASA Earthdata — Agriculture Production
Agricultural Earth-observation variables, applications, direct observations, and modeled products.NASA Earthdata — Evapotranspiration
Definition of evapotranspiration and explanation that ET is modeled rather than directly measured by satellite instruments.NASA Earthdata — Normalized Difference Vegetation Index
NDVI definition and its relationship to red and near-infrared reflectance.NASA Earthdata — Soil Moisture and Water Content
Soil-moisture products, agricultural uses, and distinctions among satellite and modeled datasets.NASA Earthdata — Soil Moisture Active Passive
SMAP surface soil-moisture observations, coverage, instruments, and products.NASA Science — Agriculture and Food Security
Landsat applications in crop monitoring, irrigation, acreage analysis, forecasting, and disaster assessment.NASA Science — OpenET Study Helps Water Managers and Farmers Put Landsat to Work
OpenET’s Landsat inputs, model ensemble, validation, and field-scale evapotranspiration estimates.ESA — Sentinel-2 Facts and Figures
Sentinel-2 spectral bands, spatial resolutions, coverage, and applications.ESA — Satellite Radar Interferometry Effective for Mapping Crops
Sentinel-1 radar time series and interferometric coherence used for crop classification.USGS — Landsat 8
Landsat 8 instrument, spatial-resolution, orbit, and acquisition specifications.USGS — Landsat Acquisition Schedules
Landsat 8 and Landsat 9 repeat cycles, orbital offset, and acquisition scheduling.USGS — Landsat Data Access
Official information about no-cost Landsat archive access and download services.USDA NASS — 2025 Cropland Data Layer Metadata
Resolution, satellite inputs, compositing, training data, and processing information for the 2025 Cropland Data Layer.USDA NASS — Cropland Data Layer Releases
Official annual product downloads, confidence layers, and release information.Copernicus Data Space Ecosystem
Official free-access portal for Copernicus Sentinel data, visualization, downloads, and processing services.
More from Earth Observation & Mapping
How Do Satellites Detect Wildfires and Smoke?
Satellites detect wildfires by measuring unusual heat in infrared wavelengths, while visible, multispectral, and aerosol observations help analysts follow smoke across the atmosphere. This guide explains how systems such as GOES, VIIRS, MODIS, Landsat, and Sentinel contribute different pieces of the wildfire-monitoring picture. Readers will learn why a thermal hotspot is not the same as an exact fire perimeter, why satellite smoke imagery cannot replace ground-level PM2.5 measurements, and how clouds, terrain, viewing geometry, and satellite overpass timing can affect detection. The article also compares commonly used fire and smoke products, explains fire radiative power and the Normalized Burn Ratio, and provides a practical framework for choosing the right map. A documented Camp Fire example shows how multiple satellite and surface datasets can complement one another. Satellite information is valuable for situational awareness, but official emergency agencies remain the appropriate source for evacuation orders, road closures, and immediate safety decisions.
What Is Synthetic Aperture Radar and How Does It Work?
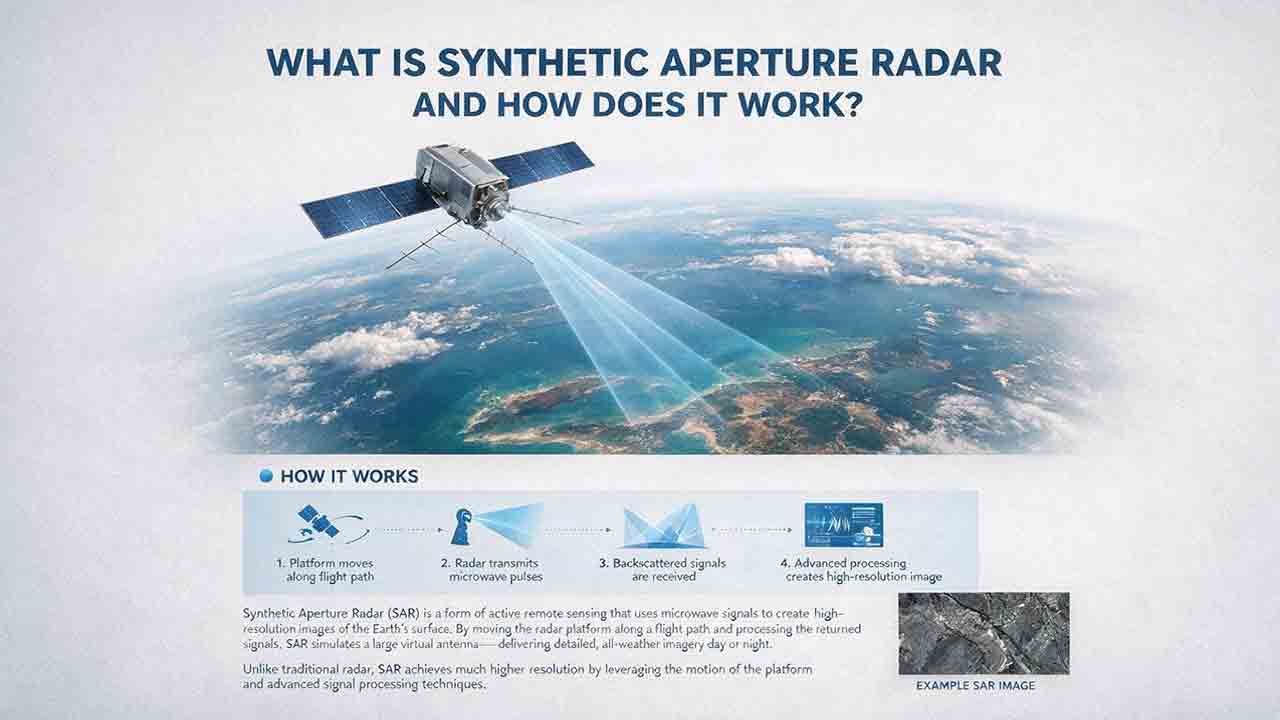
Synthetic aperture radar, or SAR, is an active Earth-observation technology that creates detailed images by transmitting microwave pulses and measuring the echoes returned from the surface. This article explains how a moving satellite or aircraft collects repeated observations to form a virtual antenna, why SAR can operate at night and through most cloud cover, and how amplitude, phase, wavelength, polarization, surface roughness, moisture, and viewing geometry affect radar imagery. It also distinguishes pixel spacing from true spatial resolution, provides a transparent range-resolution calculation, and compares SAR with optical satellite imagery. Practical sections examine scattering mechanisms, flood mapping, agriculture, forests, ice, maritime monitoring, and InSAR-based ground-deformation analysis. Original interpretation and data-selection frameworks help readers evaluate backscatter patterns, choose suitable products, identify common errors, troubleshoot unexpected results, and communicate uncertainty without treating derived radar products as guaranteed ground truth.
How Do Satellites Measure Changes in Earth’s Climate?
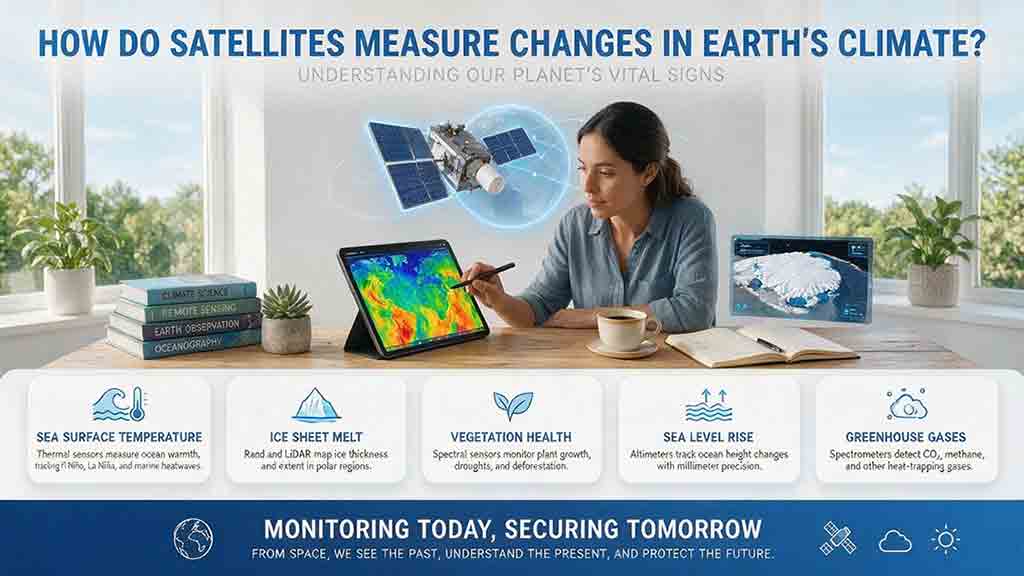
Satellites help scientists measure changes in Earth’s climate by repeatedly observing physical variables such as temperature, radiation, atmospheric gases, sea level, ice, soil moisture, vegetation, and land cover. Their instruments detect reflected sunlight, emitted heat, microwave energy, radar and laser travel time, and small changes in Earth’s gravity. These raw observations must be calibrated, corrected, validated, and combined across multiple missions before they can become reliable long-term climate records. This article explains the full path from sensor signal to scientific conclusion, including a practical sea-level measurement example. It also introduces the Signal-to-Claim Chain and the 4C Climate-Record Test, two reader frameworks for evaluating satellite datasets, maps, and climate claims by examining coverage, continuity, calibration, cross-checking, processing methods, and uncertainty.
Explore More Topics
Why Does Your Phone Sometimes Show the Wrong Location?
A phone’s location can appear incorrect even when its GPS hardware is functioning normally. Modern smartphones estimate position by combining satellite signals with Wi-Fi, cellular networks, Bluetooth, motion sensors, app permissions, and map data. This guide explains how blocked or reflected signals, cached locations, approximate permissions, battery restrictions, compass errors, and inaccurate map pins can affect the blue dot. It introduces two practical CosmoBasics troubleshooting tools—the Two Apps, Two Places Rule and the PLACE Test—to help readers distinguish app problems, environmental interference, stale data, mapping errors, and possible device-level issues. The article also provides step-by-step fixes for iPhone and Android, explains realistic smartphone accuracy under open-sky and indoor conditions, and identifies when contacting the manufacturer may be appropriate. All major technical claims are supported by first-party documentation from GPS.gov, Apple, Android, Google Maps, and Google for Developers.
How Accurate Is Consumer GPS?
Consumer GPS can often estimate horizontal position within about 5 meters under open sky, but actual accuracy varies significantly with the device, satellite geometry, signal blockage, reflected signals, antenna placement, and software processing. This guide explains what GPS accuracy figures really mean, why an app’s accuracy circle is not the same as measured error, and why smartphone references, Android confidence estimates, and government GPS performance standards should not be treated as interchangeable. It introduces the CosmoBasics Target Separation Test, a practical framework for deciding whether GPS uncertainty is small enough for a specific task. Readers will also learn how smartphones combine GNSS, Wi-Fi, cellular data, and sensors; how dual-frequency reception may improve performance; why altitude is less reliable than horizontal position; and how to test and troubleshoot a device. The article clearly identifies situations where consumer GPS is useful and where professional, certified, or regulated positioning methods are necessary.
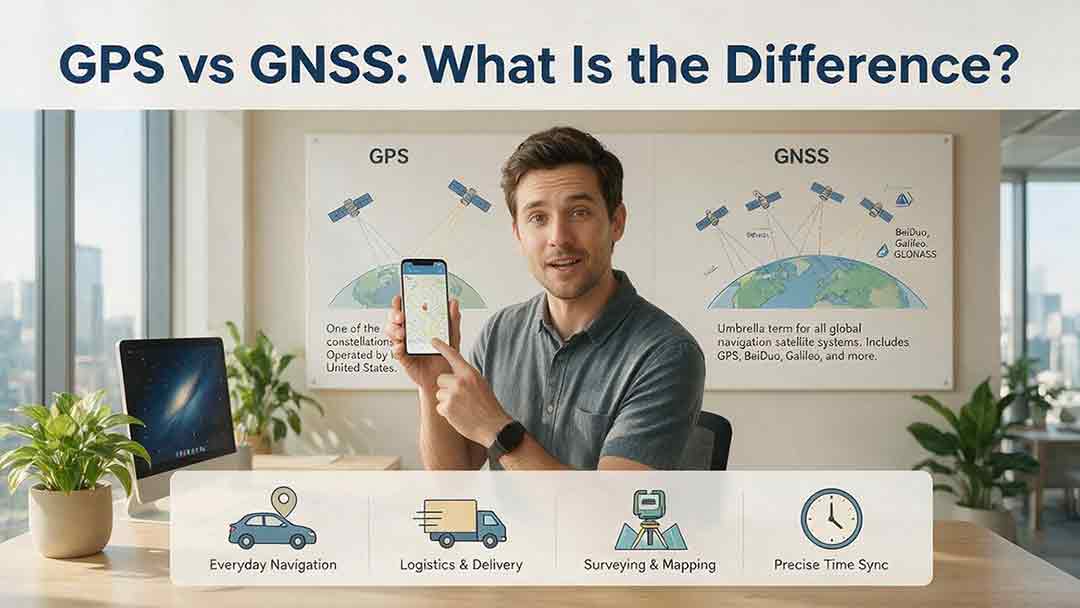
GPS vs GNSS: What Is the Difference?
GPS and GNSS are often used as if they mean the same thing, but they describe different levels of satellite navigation technology. GPS is the United States’ satellite navigation system, while GNSS is the broader category that includes GPS, Galileo, GLONASS, BeiDou, and compatible regional systems such as QZSS and NavIC. This guide explains how GPS-only and multi-GNSS receivers differ, why access to more constellations may improve signal availability, and why a larger satellite count does not automatically guarantee greater accuracy. It also examines dual-frequency reception, satellite geometry, antenna quality, correction services, sensor integration, and common positioning errors. Readers can use the Receiver Capability Stack, buying checklist, real-world examples, and troubleshooting steps to evaluate phones, watches, vehicle navigators, outdoor devices, survey receivers, and timing systems. The article is based on official technical documentation and clearly distinguishes educational examples from recognized GNSS performance standards.