How Do Satellites Detect Wildfires and Smoke?

Key Takeaways
- Satellites usually detect a wildfire from its heat signature, not by directly photographing flames.
- A hotspot marks unusual heat somewhere within a satellite pixel; it is not an exact fire perimeter.
- GOES satellites provide frequent updates, while VIIRS usually offers finer active-fire detail.
- A visible smoke plume does not show how much smoke is reaching people at ground level.
- Evacuation, road-closure, and health decisions should rely on responsible public authorities, not satellite imagery alone.
This guide explains what wildfire satellites actually measure, which map to use for a particular question, why detections sometimes disappear, and how to interpret fire and smoke products without overstating their accuracy.
Safety note: Public satellite maps are useful for situational awareness, but they should not replace evacuation notices, emergency alerts, fire-agency updates, road-closure information, air-quality guidance, or instructions from local authorities.
Which Wildfire Map Should You Use?
Start with the question you need to answer. A technically accurate map can still be the wrong tool for a particular decision.
| Your question | Start with | Important limitation |
|---|---|---|
| Is fire activity changing rapidly? | GOES-R imagery and rapid fire products | Frequent observations have relatively coarse spatial detail |
| Where was unusual heat detected? | VIIRS active-fire data in NASA FIRMS | A hotspot is an observation footprint, not a flame boundary |
| Where is smoke moving? | NOAA smoke analysis and atmospheric forecast models | Visible smoke may be elevated above the surface |
| What is the local air quality? | AirNow, AQI, and surface PM2.5 monitors | Satellite plume imagery is not a breathing-level measurement |
| What land appears to have burned? | Landsat, Sentinel-2, or official burned-area products | Clear post-fire imagery may not be immediately available |
| Should I evacuate? | Local emergency management and fire authorities | Never base an evacuation decision on a satellite hotspot map |
This table is a starting point, not a ranking of products. Operational teams often combine several data sources because each one measures a different part of the fire environment.
The Detection Process at a Glance
A wildfire map is not created from one ordinary photograph. It is assembled from measurements of emitted heat, reflected sunlight, atmospheric particles, and changes to the land surface.
A simplified detection process works like this:
- A satellite sensor measures radiation coming from Earth.
- Infrared channels identify pixels that appear unusually warm.
- An algorithm compares each possible hotspot with nearby land.
- Cloud, water, reflected sunlight, and other false-alarm tests are applied.
- Accepted detections receive coordinates, timestamps, and quality information.
- Separate imagery and aerosol products are used to identify smoke.
- Later observations help map the burned area and vegetation change.
Each stage answers a narrower question.
An active-fire product indicates where heat was detected at a particular observation time. A smoke layer shows where smoke was visible or inferred in the atmosphere. A burn-severity product estimates how the surface changed after the event.
No single layer provides a complete incident picture.
Infrared Detection of Active Fires
Active fires are usually detected because hot burning material emits much more infrared radiation than the surrounding vegetation, soil, or water.
A fire does not have to fill an entire satellite pixel. A relatively small but hot section of the pixel can alter the combined infrared signal enough to be identified by an algorithm.
Thermal Anomalies, Hotspots, and Active-Fire Detections
A thermal anomaly is a location that appears unusually warm compared with the expected temperature of its surroundings.
The terms thermal anomaly, hotspot, and active-fire detection are related, but they do not mean exactly the same thing:
- Thermal anomaly is the broad technical description of unusual heat.
- Hotspot is a convenient map label for a warm observation.
- Active-fire detection means an algorithm classified the signal as consistent with active burning.
A thermal anomaly is evidence of heat, not automatic proof of a newly ignited wildfire.
Other possible sources include:
- prescribed or agricultural burning
- industrial facilities
- gas flares
- volcanic activity
- very hot bare ground
- reflected sunlight
- sensor or processing artifacts
NASA therefore describes observations distributed through the Fire Information for Resource Management System as active fires or thermal anomalies rather than guaranteed wildfire boundaries.
Why Mid-Wave Infrared Is Important
Wildfire algorithms commonly rely on wavelengths near 4 micrometers because hot sub-pixel features can contribute a strong signal in this part of the infrared spectrum.
NOAA’s Advanced Baseline Imager fire algorithm uses a channel near 3.9 micrometers together with longer-wave infrared information, including a channel near 11.2 micrometers. The algorithm also uses contextual and screening tests to separate possible fires from ordinary warm surfaces, clouds, water, and reflected sunlight.
The official NOAA GOES-R Fire and Hot Spot Characterization documentation describes the product as a dynamic, multispectral contextual system.
The comparison between wavelengths matters because a sun-warmed surface and an active fire do not affect every infrared channel in the same way.
Brightness Temperature Is Not Flame Temperature
Satellite fire products may report brightness temperature, but that value is not the exact temperature of the flames.
Brightness temperature is the temperature a perfect emitter would need to produce the measured radiation at a particular wavelength.
A real fire pixel may contain:
- open flames
- smoldering material
- unburned vegetation
- ash
- exposed soil
- roads or buildings
- smoke
- shadows
- water
The sensor receives radiation from the combined pixel, after that radiation has passed through the atmosphere. Viewing angle and surface emissivity can also affect the measurement.
Brightness temperature is therefore a remotely sensed quantity, not a direct thermometer placed inside the fire.
How Contextual Fire Algorithms Work
A contextual fire algorithm asks whether a candidate pixel is unusually warm compared with nearby usable pixels.
A simplified version of the process is:
- Identify a potentially warm pixel.
- Estimate normal background conditions from the surrounding area.
- Compare the candidate with that background.
- Apply daytime or nighttime thresholds.
- Screen for clouds, water, coastlines, sun glint, and other problems.
- Assign a classification or confidence indicator.
The local comparison is essential. A surface temperature that appears unusual in a cool forest may be ordinary in a hot desert.
Algorithms reduce false alarms, but they do not remove uncertainty. Users should still examine the observation time, confidence information, land use, cloud cover, and official incident reports.
Fire Radiative Power
Fire radiative power, usually abbreviated as FRP, estimates the rate at which an observed fire is releasing radiant energy at the satellite observation time.
FRP can help analysts compare satellite-observed radiative activity between locations or across successive observations. It is also used in some smoke-emissions and atmospheric models.
FRP does not independently measure:
- flame length
- fireline intensity
- total burned acreage
- structural damage
- containment difficulty
- danger to a particular home
- the amount of smoke reaching ground level
Changes in FRP may reflect changes in burning activity, but the measurement can also be affected by clouds, viewing geometry, pixel coverage, sensor saturation, and the portion of the fire visible from space.
NASA’s VIIRS active-fire documentation explains the attributes provided with active-fire records, including acquisition time, brightness temperature, scan dimensions, track dimensions, confidence information, and FRP where supported by the product.
How Satellites Detect and Track Smoke
Fire detection and smoke detection are connected, but they are not the same remote-sensing task.
An active fire can be detected from infrared heat at night. Smoke is usually easiest to observe during daylight because visible imagery depends on reflected sunlight.
Visible Imagery Shows Plume Shape and Movement
In visible satellite imagery, smoke may appear white, gray, brown, tan, or slightly blue. Its appearance depends on plume thickness, particle properties, sunlight, viewing angle, cloud cover, and the surface below it.
Analysts look for several clues:
- a plume connected to an active-fire area
- a diffuse, fibrous, or layered texture
- movement between consecutive images
- consistency with winds at the plume’s altitude
- nearby thermal anomalies
- gradual spreading or thinning downwind
A single still image can be ambiguous. An animation is often more useful because smoke changes and travels differently from many cloud formations.
NOAA’s Hazard Mapping System combines satellite products with analyst interpretation to map fires and smoke over North America and nearby regions.
Multispectral Imagery Helps Separate Smoke From Clouds
Thin smoke can resemble dust, haze, cirrus clouds, fog, or bright ground in a natural-color image.
Multispectral imagery improves interpretation by combining measurements from several parts of the spectrum:
- Visible bands show reflected sunlight.
- Near-infrared bands help distinguish vegetation and cloud properties.
- Shortwave-infrared bands can reveal active burning and recently burned surfaces.
- Thermal infrared bands show temperature differences.
- Ultraviolet-sensitive measurements can identify some absorbing aerosols.
These combinations do not guarantee correct classification. They provide multiple pieces of evidence that can be considered together.
The strongest smoke interpretation usually combines plume appearance, movement, wind data, fire detections, and repeated observations.
Aerosol Optical Depth
Aerosol optical depth, or AOD, describes how strongly airborne particles scatter or absorb light through the atmospheric column.
AOD is often described as a measure of column-integrated aerosol loading. It does not directly measure particle concentration at breathing level.
Wildfire smoke can increase AOD, but high values may also be influenced by:
- dust
- urban pollution
- sea salt
- other aerosol mixtures
- cloud contamination
- bright ground surfaces
- retrieval uncertainty
NASA provides a general explanation through its Aerosol Optical Depth resource.
Why Smoke Imagery Is Not a PM2.5 Reading
A satellite may observe a dense smoke layer thousands of feet above a community while surface air remains relatively clear.
The reverse is also possible. Smoke can become trapped near the ground beneath clouds or an atmospheric inversion, making the surface air unhealthy while the satellite view is incomplete.
Satellite smoke imagery cannot independently answer:
- Is the air safe for outdoor exercise?
- What is the current neighborhood AQI?
- How much PM2.5 is present at breathing level?
- Is smoke entering a particular building?
- What precautions should a person with a medical condition take?
The AirNow Fire and Smoke Map combines PM2.5 monitors, temporary monitors, air sensors, smoke information, forecasts, and other data. AirNow cautions that satellite-detected plumes indicate atmospheric smoke that may not be affecting air quality at the surface.
Personal health decisions should rely on current local AQI, surface PM2.5 observations, official public-health guidance, and appropriate medical advice.
Geostationary and Polar-Orbiting Satellites
No satellite system is best for every wildfire question.
Geostationary satellites provide frequent regional observations. Polar-orbiting satellites usually provide more spatial detail but only when they pass over the location.
Geostationary Satellites: Frequent Updates
A geostationary satellite orbits at approximately the same rate that Earth rotates, allowing it to observe the same broad region repeatedly.
The GOES-R series uses the Advanced Baseline Imager to monitor large parts of the Western Hemisphere. Depending on the scan sector and operational mode, observations may be available every few minutes.
Frequent imagery is valuable for:
- recognizing rapid changes
- estimating when a heat signal appeared
- following growth between scans
- tracking smoke development
- observing interaction with clouds and weather
- monitoring changes during the daily heating cycle
The tradeoff is spatial detail. Key infrared fire channels have nominal kilometer-scale resolution, and the effective footprint becomes larger away from the satellite’s best viewing geometry.
Geostationary imagery is particularly useful for answering:
How is the situation changing?
Polar-Orbiting Satellites: More Detailed Snapshots
Polar-orbiting satellites circle Earth while the planet rotates beneath them. They provide broad global coverage but do not remain continuously over one region.
VIIRS instruments aboard Suomi NPP, NOAA-20, and NOAA-21 support active-fire products based on nominal 375-meter observations near nadir.
VIIRS is useful for:
- locating smaller heat sources
- separating nearby hotspots
- mapping fragmented fire activity
- observing both day and night
- supporting regional and global fire records
The limitation is timing. A fire can ignite, spread, weaken, or move between overpasses.
VIIRS is particularly useful for answering:
Where was unusual heat detected during this overpass?
Land-Imaging Satellites: Detailed Surface Change
Landsat and Sentinel-2 provide finer land-surface detail, but they do not continuously monitor active fire behavior.
Their imagery is especially useful for:
- mapping burn scars
- refining affected-area boundaries
- examining vegetation loss
- comparing pre-fire and post-fire conditions
- monitoring recovery
- supporting ecological and watershed assessment
These satellites are better suited to answering:
What changed on the ground?
Satellite Systems Compared
| System | Update pattern | Typical detail | Best use | Main limitation |
|---|---|---|---|---|
| GOES-R ABI | Minutes, depending on scan sector | About 2 km for key infrared fire channels near nadir | Rapid fire changes and smoke development | Relatively coarse spatial detail |
| VIIRS | Several contributing polar-orbiting passes | Nominal 375 m near nadir | Detailed active-fire locations and nighttime detection | Gaps between overpasses |
| MODIS | Scheduled Terra and Aqua observations | Approximately 1 km for active-fire products | Long-running global and regional fire records | Coarser than VIIRS |
| Landsat 8 and 9 | Nominal combined eight-day opportunity | 30 m for commonly used reflective bands | Burn scars, land change, and recovery | Clouds and acquisition timing limit usable images |
| Sentinel-2 | Periodic optical observations | Commonly used bands at 10–20 m | Detailed burned-area and vegetation mapping | No continuous dedicated thermal monitoring |
| Sentinel-3 | Repeated broad-area observations | Approximately 300 m for some burned-area applications | Regional monitoring and broader coverage | Less local detail than Landsat or Sentinel-2 |
These values are nominal and product-dependent.
Actual usefulness changes with:
- viewing geometry
- scan position
- cloud cover
- latitude
- acquisition planning
- processing latency
- sensor condition
- product version
- the temperature and size of the fire
NASA notes that VIIRS produces approximately 375-meter pixels near nadir, while actual pixel dimensions increase farther across the scan. The scan and track fields included with the data are more informative than assuming every observation covers a fixed square.
USGS states that Landsat 8 and Landsat 9 each repeat a ground track every 16 days. Their offset orbits create a nominal combined eight-day imaging opportunity, although clouds and acquisition conditions can delay a usable observation.
ESA describes Sentinel-2 multispectral imagery at 10–20 meters as useful for detailed burned-area mapping, with Sentinel-3 providing coarser but more frequent regional coverage.
What a Satellite Fire Pixel Actually Means
A hotspot marker means an algorithm detected unusual heat somewhere within or near a satellite observation footprint.
It does not mean:
- the entire pixel is burning
- every property under the marker is affected
- the marker outlines the flame front
- the point is the center of an official perimeter
- the fire remains active when the map is viewed
- the location is accurate to an individual road or building
A nominal 375 m × 375 m footprint covers about 140,625 square meters, or approximately 0.141 square kilometers.
The actual burning area may be only a small fraction of that footprint. A sufficiently hot source can still alter the radiation measured across the pixel.
The footprint is not always a fixed square. Its dimensions and shape change with scan position and viewing geometry.
Map design creates another potential misunderstanding. A website may display each detection as a fixed-size dot, square, or flame icon. That symbol may be visually smaller or larger than the observation footprint, particularly when the map is zoomed.
Practical interpretation: Read a hotspot as “unusual heat was detected within this observation area,” not “everything inside this symbol was burning.”
Zooming in on a street map does not increase the spatial resolution of the satellite sensor.
Hotspot, Perimeter, Smoke, and Burned-Area Products
Different wildfire layers answer different questions.
| Product | What it represents | Best question it answers | What it does not prove |
|---|---|---|---|
| Active-fire hotspot | A satellite-classified thermal anomaly | Where was unusual heat observed? | Exact flame boundaries |
| Fire perimeter | A mapped or estimated incident boundary | What area is associated with the incident? | That every location inside burned equally |
| Smoke plume | Visible or inferred smoke in the atmosphere | Where was smoke observed? | Surface PM2.5 at every location |
| Fire radiative power | Estimated radiant energy release | How did observed radiative activity compare? | Total acreage or danger level |
| Aerosol optical depth | Optical effect of aerosols through the atmospheric column | Where is aerosol loading relatively elevated? | Direct breathing-level concentration |
| Burn scar | Land showing post-fire spectral change | What surface appears to have burned? | Immediate structural safety |
| Burn severity | Estimated degree of vegetation or soil change | How strongly did the surface change? | A complete ecological or property-loss assessment |
A hotspot map should not be used as an official perimeter. A smoke polygon should not be treated as a neighborhood AQI map. A burn-severity index should not be treated as a complete field assessment.
Post-Fire Mapping With Landsat and Sentinel
Once smoke and clouds clear, land-imaging satellites can help show where the surface changed.
Burned vegetation commonly shows:
- lower near-infrared reflectance
- altered shortwave-infrared reflectance
- darker visible appearance
- exposed soil or ash
- reduced plant moisture
- changed vegetation structure
Analysts compare these signals with pre-fire imagery to distinguish burning from land that was already dry, bare, harvested, shadowed, or disturbed.
Normalized Burn Ratio
The Normalized Burn Ratio, or NBR, is a spectral index used to highlight burned areas and evaluate fire-related surface change.
For Landsat 8 and Landsat 9, the basic formula is:
NBR = (NIR − SWIR2) / (NIR + SWIR2)
Healthy vegetation often reflects strongly in near-infrared wavelengths. Recently burned surfaces commonly have lower near-infrared reflectance and a different shortwave-infrared response.
USGS documents the formula and its applications in its Landsat Normalized Burn Ratio guide.
Before-and-After Analysis
A typical workflow is:
- Select a suitable pre-fire surface-reflectance image.
- Mask clouds, cloud shadows, snow, and poor-quality pixels.
- Calculate or obtain the pre-fire NBR.
- Select a comparable post-fire image.
- Calculate the post-fire NBR.
- Compare the two observations.
- Interpret the change using local conditions and field information.
The difference between pre-fire and post-fire NBR is commonly called dNBR.
dNBR can support burn-severity mapping, but classification thresholds should not be transferred blindly between ecosystems. Vegetation type, season, drought, soil, terrain, image timing, and post-fire regrowth can alter the result.
A spectral index indicates surface change. It does not independently establish ecological loss, structural safety, or long-term recovery.
The CosmoBasics Four-Layer Framework for Reading Wildfire Maps
We developed this editorial framework to help general readers avoid common mistakes when comparing wildfire products.
It is an interpretation aid, not an operational firefighting method, scientific detection algorithm, or independently validated risk model.
1. Signal: What Was Measured?
Identify the physical observation or estimate behind the layer:
- emitted infrared radiation
- reflected visible light
- spectral change in vegetation
- column-integrated aerosol loading
- estimated radiative activity
- modeled smoke transport
- an official field-based record
A layer labeled “fire” may represent a thermal observation, an incident boundary, a model output, or a combination of sources.
2. Scale: What Area Does It Represent?
Check:
- nominal pixel size
- actual scan and track dimensions
- viewing angle
- map-symbol size
- whether the data were resampled
- whether observations were grouped
A coarse fire product remains coarse when it is displayed over a detailed street map.
3. Time: When Was It Collected?
Look for:
- satellite acquisition time
- time zone
- processing time
- latest overpass
- selected map window
- forecast validity period
- whether several observation times are combined
A website updated at 4:00 p.m. may still contain a hotspot collected hours earlier.
4. Consequence: What Decision Are You Making?
Match the decision to the responsible information source:
| Decision | Source to prioritize |
|---|---|
| Whether to evacuate | Local emergency management and fire authorities |
| Whether a road is open | Transportation agency or local government |
| Current incident status | Official incident-management sources |
| General fire location | Satellite thermal-anomaly products |
| Regional smoke movement | Satellite imagery and forecast models |
| Personal air-quality precautions | AQI, PM2.5 monitors, and public-health guidance |
| Burned-land assessment | High-resolution imagery, severity products, and field observations |
The framework can be remembered as four questions:
What was measured, at what scale, at what time, and for what decision?
Observed, Derived, Modeled, or Confirmed?
Another useful distinction is the evidence level of the information.
Observed
The sensor directly measured radiation associated with heat, reflected light, or atmospheric particles.
Examples include:
- infrared radiance
- visible imagery
- multispectral reflectance
- brightness temperature
Derived
An algorithm transformed observations into a classification or estimate.
Examples include:
- active-fire classification
- fire radiative power
- aerosol optical depth
- NBR
- burn-severity category
Modeled
A computer model estimated a present or future atmospheric condition.
Examples include:
- smoke transport
- plume height
- emissions
- near-surface smoke forecasts
- air-quality forecasts
Confirmed
A responsible authority or field team incorporated ground information into an operational record.
Examples include:
- an official incident perimeter
- an evacuation zone
- a road closure
- a containment update
- a field-validated severity map
Scientific usefulness does not require every product to be officially confirmed. The distinction helps readers understand how far the information has moved from measurement toward interpretation and decision-making.
Historical Case: What the 2018 Camp Fire Products Revealed
The 2018 Camp Fire in Northern California provides a well-documented example of why different satellite products should be used together.
This section is an editorial comparison of published official material. It is not an independent scientific experiment, a reconstruction of emergency decision-making, or an evaluation of agency response.
GOES Showed Rapid Development
NOAA published GOES-16 fire-temperature imagery from November 8, 2018, showing hotspots and the development of a large smoke plume.
The value of the geostationary view was continuity. Repeated images could show the fire and plume changing over time rather than providing only one isolated snapshot.
The imagery was useful for understanding rapid development, but its relatively coarse fire pixels were not intended to map individual structures or exact flame boundaries.
Official example: NOAA — Satellite Imagery RGBs: Adding Value, Saving Time
Landsat Added Detailed Surface Context
NASA reports that Landsat 8 acquired imagery at approximately 10:45 a.m. local time on November 8, about four hours after the fire began.
Visible imagery was heavily affected by smoke, but a combination including shortwave-infrared and thermal-infrared data revealed active heat and the fire front beneath part of the plume.
This example shows why “satellite image” is too broad a description. A natural-color view and an infrared composite from the same satellite can reveal different information.
Official examples:
- NASA Earth Observatory — Camp Fire Rages in California
- NASA Landsat — The Synoptic View of California’s Camp Fire
- USGS — Landsat Images of the Camp Fire
VIIRS Showed Fire and Smoke in a Polar-Orbiting Snapshot
NASA published a Suomi NPP VIIRS image collected on November 8 with thermally detected active-fire locations displayed over the scene.
NOAA also published NOAA-20 VIIRS imagery from 8:40 p.m. Pacific Time that day. The multispectral image showed hot land associated with active fire or burn scars in dark red and smoke moving toward the Pacific in gray and white.
These images offered more spatial detail than the broad geostationary view, but they represented particular overpasses rather than a continuous record.
Official examples:
- NASA — Late Season California Fire Erupts Near Chico
- NOAA — Plumes of Smoke Cover Portions of Northern California
Surface Pollution Required More Than a Smoke Image
A later NOAA-led study compared the experimental HRRR-Smoke model with satellite observations and surface PM2.5 measurements during the Camp Fire.
The published analysis found that the model represented important aspects of the initial smoke evolution and later pollution intensification, but it also identified periods when PM2.5 was underestimated. One possible factor discussed by the researchers was an underestimate of satellite-derived FRP used in the modeling process.
This is a useful limitation, not a failure of satellite observation. Satellite heat measurements, smoke transport models, and ground PM2.5 sensors describe different parts of the same event.
Official references:
- NOAA Research — Study Validates Smoke Forecasting During the Camp Fire
- NOAA Institutional Repository — High-Resolution Smoke Forecasting for the 2018 Camp Fire
What This Case Demonstrates
The Camp Fire products did not compete to produce one “correct” map.
They answered different questions:
| Product | Main contribution |
|---|---|
| GOES-16 | Showed rapid change and plume development through repeated observations |
| Landsat 8 | Added detailed infrared and land-surface context |
| VIIRS | Provided a more detailed polar-orbiting snapshot of heat and smoke |
| HRRR-Smoke | Estimated smoke movement and near-surface effects |
| Surface PM2.5 sensors | Measured pollution where people were breathing |
A reader comparing the maps without checking scale, time, wavelength, and product purpose could wrongly conclude that they disagreed. In reality, each product observed or estimated a different part of the event.
Why Satellites Miss or Lose Fire Signals
A missing hotspot does not prove that a fire is extinguished.
Clouds
Opaque clouds can block both thermal and visible observations of the surface.
A fire may continue beneath cloud without appearing in an active-fire product. Smoke mapping can also become incomplete when clouds cover part of the plume.
Small or Smoldering Fires
A small, cool, smoldering, or partially concealed fire may not alter the combined pixel signal enough to pass the algorithm’s tests.
Detection depends on:
- burning area
- temperature
- background conditions
- sensor sensitivity
- time of day
- viewing angle
- atmospheric conditions
- algorithm thresholds
There is no universal minimum fire size that every satellite can detect under all conditions.
Canopy and Terrain
Dense vegetation can conceal part of the heat signal. Canyon walls, slopes, and uneven terrain can affect visibility and apparent location.
A fire beneath a thick forest canopy may be more difficult to identify than a fire of similar radiative activity in open grassland.
Viewing Geometry
Pixels generally become larger or more distorted away from the center of a satellite scan or away from the best geostationary viewing region.
This can affect:
- effective spatial detail
- apparent location
- detection sensitivity
- alignment with roads and boundaries
- the amount of background land included in a pixel
Gaps Between Overpasses
Polar-orbiting satellites only observe a location when their orbit passes nearby.
A fire may begin, weaken, or move between observations. Several satellites can reduce these gaps but cannot provide uninterrupted high-resolution monitoring.
Map Filters and Time Windows
A detection may disappear because:
- the selected time range changed
- an older point was removed
- the map switched sensors
- a confidence filter was applied
- processing was delayed
- a rapid record was replaced by a standard product
- the latest data feed had not arrived
Always check the map legend, sensor, acquisition time, and selected filters.
False Alarms
Non-wildfire thermal signals may include industrial heat, gas flares, agricultural burns, volcanoes, hot bare ground, or reflected sunlight.
Repeated observations and official incident information help distinguish persistent wildfire activity from other heat sources.
Which Wildfire Product Should You Use?
The correct product depends on the user and the decision.
Residents Near an Active Fire
Check local emergency management first.
Use satellite products only for broad situational awareness. Do not wait for a hotspot to appear near a home before following an evacuation order.
Priority sources are:
- emergency alerts
- evacuation notices
- official fire-agency updates
- road-closure information
- local air-quality guidance
Travelers and Outdoor Users
Check:
- official closures
- incident status
- fire-weather forecasts
- smoke forecasts
- AQI
- transportation disruptions
- local alerts
An area outside the mapped fire perimeter may still be affected by smoke, changing winds, emergency traffic, or access restrictions.
Air-Quality Readers
Use satellite smoke imagery to understand regional transport, then use PM2.5 monitors and AQI to evaluate conditions near the surface.
Consider:
- monitor distance
- observation time
- elevation
- wind direction
- sensor quality
- whether smoke is elevated
Researchers
Record the exact dataset details:
- platform
- instrument
- collection or version
- processing level
- spatial resolution
- acquisition time
- quality flags
- latency
- cloud-screening method
A general label such as “NASA fire data” is not sufficient for reproducible analysis.
Land Managers
Combine:
- active-fire products
- official perimeters
- Landsat or Sentinel imagery
- spectral indices
- field observations
- vegetation and soil information
Satellite change detection can identify areas for closer assessment, but it does not replace field-based evaluation.
Near-Real-Time and Science-Quality Data
Near-real-time products prioritize speed. Standard science products prioritize consistent calibration, quality control, and reproducibility.
Rapid products are useful for:
- monitoring
- alerts
- situational awareness
- time-sensitive mapping
They may later be replaced or reprocessed when standard data become available.
NASA FIRMS explains that near-real-time MODIS and VIIRS records in its archive are replaced with detections extracted from standard products after those products become available. NASA advises users conducting scientific analysis to use the standard science-quality data when latency is not important.
A practical rule is:
- Use near-real-time products when speed is the main requirement.
- Use standard products when final calibration and reproducibility are more important.
Replacement schedules and quality procedures can differ between datasets. Researchers should document the product version and processing level instead of assuming every rapid product follows the same workflow.
Satellite Wildfire Map Checklist
Before interpreting, sharing, or acting on a wildfire map, confirm:
- What physical signal does the layer represent?
- Is the information observed, derived, modeled, or officially confirmed?
- Which satellite and instrument produced it?
- What is the nominal spatial resolution?
- Does viewing geometry make the actual footprint larger?
- What time was the observation collected?
- Is the timestamp UTC or local time?
- Does the map combine several observation times?
- Is the layer near-real-time, standard science data, or a forecast?
- Are clouds blocking the fire or smoke?
- Does the symbol represent a pixel rather than a perimeter?
- Could the heat source be agricultural, industrial, or volcanic?
- Is the smoke elevated above the surface?
- Has an official agency confirmed the incident?
- Is the product appropriate for the decision being made?
Common Interpretation Mistakes
Treating Every Hotspot as a New Wildfire
A hotspot may represent agricultural burning, industrial heat, volcanic activity, or another thermal anomaly.
Better approach: Check land use, confidence, persistence, visible imagery, and official reports.
Assuming the Whole Pixel Is Burning
Only a small part of an observation footprint may contain active heat.
Better approach: Treat the marker as an approximate detection area, not a flame boundary.
Comparing Maps Without Checking Time
Two maps may show different conditions because they were collected hours apart.
Better approach: Compare acquisition timestamps, not only webpage update times.
Comparing Maps Without Checking Resolution
A GOES pixel and a VIIRS pixel represent different spatial scales.
Better approach: Check nominal detail, viewing geometry, and map-symbol size.
Treating Smoke as Surface Air Quality
A plume may be elevated far above the ground.
Better approach: Pair satellite smoke imagery with PM2.5 monitors, AQI, and public-health guidance.
Assuming No Hotspot Means No Fire
Cloud, canopy, smoldering combustion, weak heat, or timing gaps can hide a fire.
Better approach: Compare several products and official ground information.
Believing Map Zoom Improves Accuracy
A detailed basemap can make a coarse satellite point appear property-specific.
Better approach: Judge the observation by its sensor footprint, not by the streets displayed beneath it.
Using Satellite Fire Information Responsibly
Satellites are especially valuable because they can observe large, remote, and hazardous regions without placing observers inside the fire zone.
Their strengths are complementary. Rapid geostationary imagery shows change. VIIRS provides more detailed active-fire observations. Landsat and Sentinel reveal post-fire surface effects. Smoke products describe atmospheric transport, while surface monitors describe air where people are breathing.
Satellite products cannot independently determine whether a home is safe, a road is open, an evacuation is necessary, or smoke exposure is medically acceptable.
The practical method is to match the source to the decision:
- Use fire maps for regional heat observations.
- Use smoke imagery for plume movement.
- Use PM2.5 monitors for local air quality.
- Use land imagery for post-fire surface change.
- Use official authorities for public-safety instructions.
The most important questions remain simple:
What was measured, at what scale, at what time, and for what purpose?
Frequently Asked Questions
Can satellites detect a wildfire before anyone reports it?
Yes. A sufficiently hot and unobscured fire may produce an infrared anomaly before a public ground report is available.
Early detection is not guaranteed. Small fires, clouds, dense canopy, terrain, viewing geometry, algorithm thresholds, and gaps between overpasses can delay or prevent detection. An automated hotspot should also be checked against official reports before being described as a confirmed wildfire.
Can satellites see fire through smoke?
Infrared radiation from a fire can often pass through some smoke, allowing thermal sensors to detect heat that is difficult to see in an ordinary photograph.
Thick smoke, clouds, water droplets, vegetation, and terrain can still weaken or block the signal. The ability to detect heat through smoke is therefore conditional, not unlimited.
Can satellites detect wildfires at night?
Yes. Thermal infrared sensors do not require sunlight to identify active-fire heat.
Ordinary visible smoke imagery is much more limited at night because it depends on reflected sunlight. Specialized nighttime observations can add information, but daytime multispectral imagery remains more useful for mapping many smoke features.
How accurate is a satellite hotspot location?
Accuracy depends on the sensor, pixel dimensions, viewing geometry, terrain, geolocation processing, and map display.
A nominal 375-meter VIIRS detection provides more spatial detail than a kilometer-scale weather-satellite pixel, but neither should be interpreted automatically as the exact location of a flame front, road crossing, building, or property boundary.
Why do wildfire maps show different numbers of fires?
Maps may use different satellites, time windows, confidence filters, algorithms, product versions, and definitions.
One map may display all recent thermal anomalies, while another shows only selected sensors or officially recognized incidents. Different point counts do not necessarily indicate that one map is wrong.
Can satellite maps predict where smoke will go?
Satellite imagery shows where smoke was observed at a particular time. Forecast models estimate where it may travel by combining fire observations with winds, weather, emissions estimates, plume height, and atmospheric physics.
Forecasts remain uncertain because fire activity and atmospheric conditions can change quickly. Local PM2.5 monitors remain important for evaluating actual surface conditions.
How This Article Was Reviewed
This article was checked against primary documentation and public guidance from NASA, NOAA, USGS, the U.S. Environmental Protection Agency, the U.S. Forest Service, and the European Space Agency.
The review included:
- NASA FIRMS active-fire documentation
- NASA Earthdata documentation for VIIRS and aerosol products
- NOAA documentation for GOES-R fire detection
- NOAA Hazard Mapping System smoke guidance
- USGS documentation for Landsat acquisition and NBR
- AirNow guidance on smoke and surface air quality
- ESA documentation on Sentinel burned-area capabilities
- official NASA, NOAA, and USGS material about the 2018 Camp Fire
Technical specifications, product descriptions, and public links were last checked on August 2, 2026.
This article did not involve hands-on testing of satellite instruments, independent validation of operational fire algorithms, or participation in wildfire response. No review by an incident commander, firefighter, air-quality clinician, or operational remote-sensing specialist is claimed.
Sources
NASA FIRMS — Active Fire Data
Supports active-fire data access, MODIS and VIIRS coverage, near-real-time processing, and standard science-data guidance.NASA FIRMS — Interactive Fire Map
Supports the interpretation of thermal anomalies, observation footprints, and cloud-related limitations.NASA Earthdata — VIIRS I-Band 375 m Active Fire Data
Supports nominal VIIRS resolution, contextual fire detection, viewing geometry, acquisition fields, and pixel dimensions.NASA Earthdata — Aerosol Optical Depth
Supports the definition of AOD as the optical effect of aerosols through the atmospheric column.NOAA STAR — Fire and Hot Spot Characterization
Supports the GOES-R contextual algorithm, 3.9- and 11.2-micrometer channels, cloud screening, and FRP discussion.NOAA — GOES-R Fire Detection Algorithm Document
Provides detailed technical information about the ABI fire algorithm and its assumptions.NOAA OSPO — Hazard Mapping System
Supports the description of NOAA fire and smoke analysis.AirNow — Fire and Smoke Map
Supports the distinction between atmospheric smoke and ground-level PM2.5.USGS — Landsat Acquisition Schedules
Supports the 16-day cycle for each Landsat satellite and nominal eight-day combined opportunity.USGS — Landsat Normalized Burn Ratio
Supports the NBR formula and burned-area applications.ESA Knowledge Hub — Burned Areas
Supports Sentinel-2 and Sentinel-3 burned-area capabilities.NASA Earth Observatory — Camp Fire Rages in California
Supports the November 8, 2018 Landsat acquisition and infrared interpretation.NASA Landsat — The Synoptic View of California’s Camp Fire
Supports the detailed Camp Fire Landsat case comparison.NASA — Late Season California Fire Erupts Near Chico
Supports the Suomi NPP VIIRS observation of the Camp Fire.NOAA — Plumes of Smoke Cover Portions of Northern California
Supports the NOAA-20 VIIRS observation and multispectral interpretation.NOAA Research — Camp Fire Smoke Forecasting Study
Supports the discussion of modeled smoke, satellite observations, and surface PM2.5 comparison.
More from Earth Observation & Mapping
How Are Satellite Images Used in Agriculture?
Satellite images help farmers, agronomists, researchers, insurers, and public agencies monitor agricultural land across fields, regions, and growing seasons. This guide explains how optical, radar, thermal, and microwave satellite observations support crop-development monitoring, irrigation analysis, field mapping, flood and drought assessment, crop classification, and regional production forecasting. It distinguishes what satellites directly observe from calculated indices, classification results, and modeled estimates such as evapotranspiration. Readers will also learn how NDVI works, why spatial resolution and image timing matter, and when drones or field scouting are more appropriate. The original CosmoBasics SCALE Framework provides a practical way to decide whether satellite imagery fits a specific agricultural problem. Documented examples from USDA and OpenET show how operational products combine multiple observations, reference data, weather information, and models. Throughout the guide, satellite imagery is treated as a screening and monitoring tool—not a substitute for field verification, laboratory testing, or professional agricultural judgment.
What Is Synthetic Aperture Radar and How Does It Work?
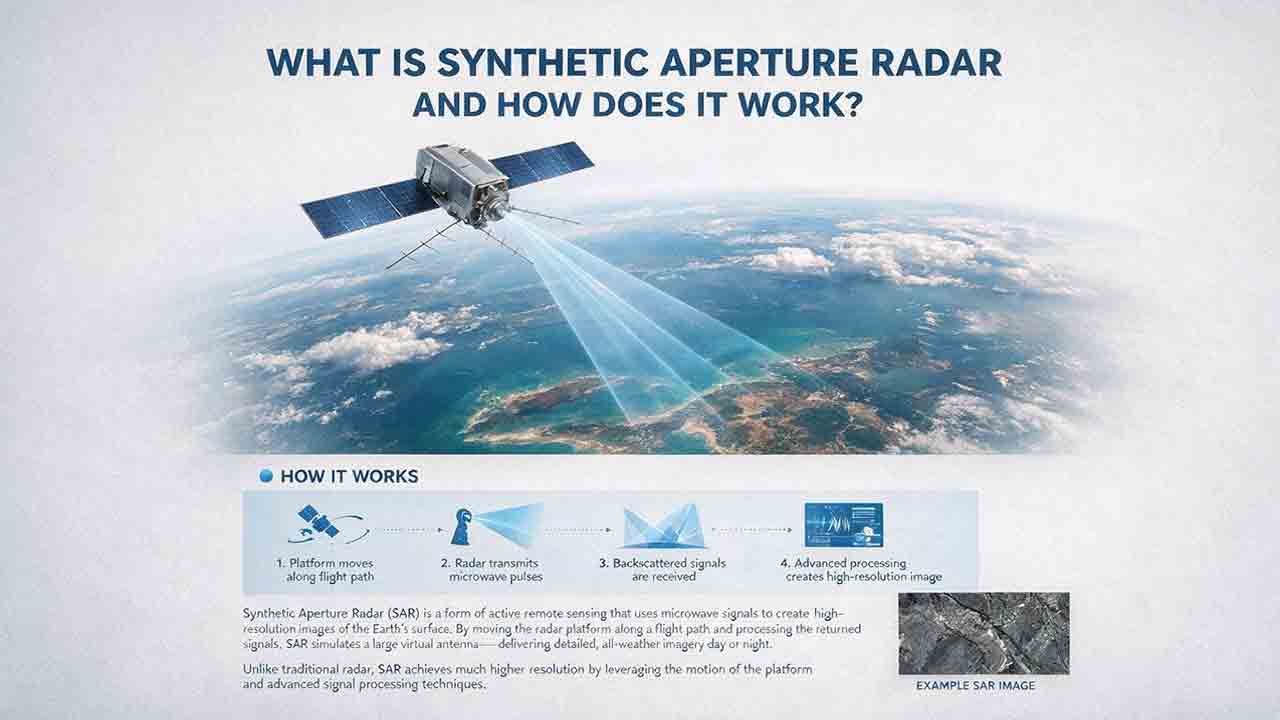
Synthetic aperture radar, or SAR, is an active Earth-observation technology that creates detailed images by transmitting microwave pulses and measuring the echoes returned from the surface. This article explains how a moving satellite or aircraft collects repeated observations to form a virtual antenna, why SAR can operate at night and through most cloud cover, and how amplitude, phase, wavelength, polarization, surface roughness, moisture, and viewing geometry affect radar imagery. It also distinguishes pixel spacing from true spatial resolution, provides a transparent range-resolution calculation, and compares SAR with optical satellite imagery. Practical sections examine scattering mechanisms, flood mapping, agriculture, forests, ice, maritime monitoring, and InSAR-based ground-deformation analysis. Original interpretation and data-selection frameworks help readers evaluate backscatter patterns, choose suitable products, identify common errors, troubleshoot unexpected results, and communicate uncertainty without treating derived radar products as guaranteed ground truth.
How Do Satellites Measure Changes in Earth’s Climate?
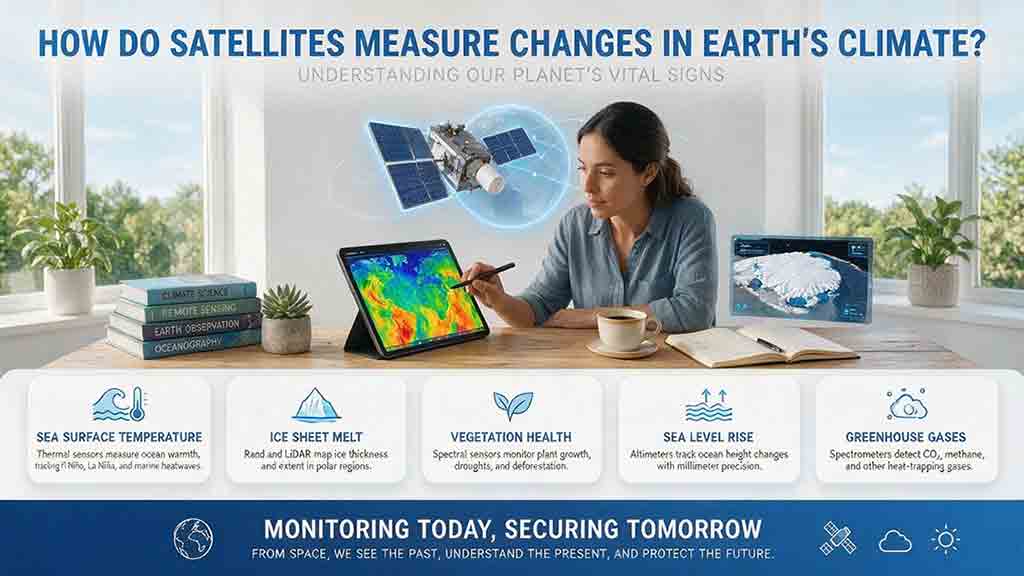
Satellites help scientists measure changes in Earth’s climate by repeatedly observing physical variables such as temperature, radiation, atmospheric gases, sea level, ice, soil moisture, vegetation, and land cover. Their instruments detect reflected sunlight, emitted heat, microwave energy, radar and laser travel time, and small changes in Earth’s gravity. These raw observations must be calibrated, corrected, validated, and combined across multiple missions before they can become reliable long-term climate records. This article explains the full path from sensor signal to scientific conclusion, including a practical sea-level measurement example. It also introduces the Signal-to-Claim Chain and the 4C Climate-Record Test, two reader frameworks for evaluating satellite datasets, maps, and climate claims by examining coverage, continuity, calibration, cross-checking, processing methods, and uncertainty.
Explore More Topics
Why Does Your Phone Sometimes Show the Wrong Location?
A phone’s location can appear incorrect even when its GPS hardware is functioning normally. Modern smartphones estimate position by combining satellite signals with Wi-Fi, cellular networks, Bluetooth, motion sensors, app permissions, and map data. This guide explains how blocked or reflected signals, cached locations, approximate permissions, battery restrictions, compass errors, and inaccurate map pins can affect the blue dot. It introduces two practical CosmoBasics troubleshooting tools—the Two Apps, Two Places Rule and the PLACE Test—to help readers distinguish app problems, environmental interference, stale data, mapping errors, and possible device-level issues. The article also provides step-by-step fixes for iPhone and Android, explains realistic smartphone accuracy under open-sky and indoor conditions, and identifies when contacting the manufacturer may be appropriate. All major technical claims are supported by first-party documentation from GPS.gov, Apple, Android, Google Maps, and Google for Developers.
How Accurate Is Consumer GPS?
Consumer GPS can often estimate horizontal position within about 5 meters under open sky, but actual accuracy varies significantly with the device, satellite geometry, signal blockage, reflected signals, antenna placement, and software processing. This guide explains what GPS accuracy figures really mean, why an app’s accuracy circle is not the same as measured error, and why smartphone references, Android confidence estimates, and government GPS performance standards should not be treated as interchangeable. It introduces the CosmoBasics Target Separation Test, a practical framework for deciding whether GPS uncertainty is small enough for a specific task. Readers will also learn how smartphones combine GNSS, Wi-Fi, cellular data, and sensors; how dual-frequency reception may improve performance; why altitude is less reliable than horizontal position; and how to test and troubleshoot a device. The article clearly identifies situations where consumer GPS is useful and where professional, certified, or regulated positioning methods are necessary.
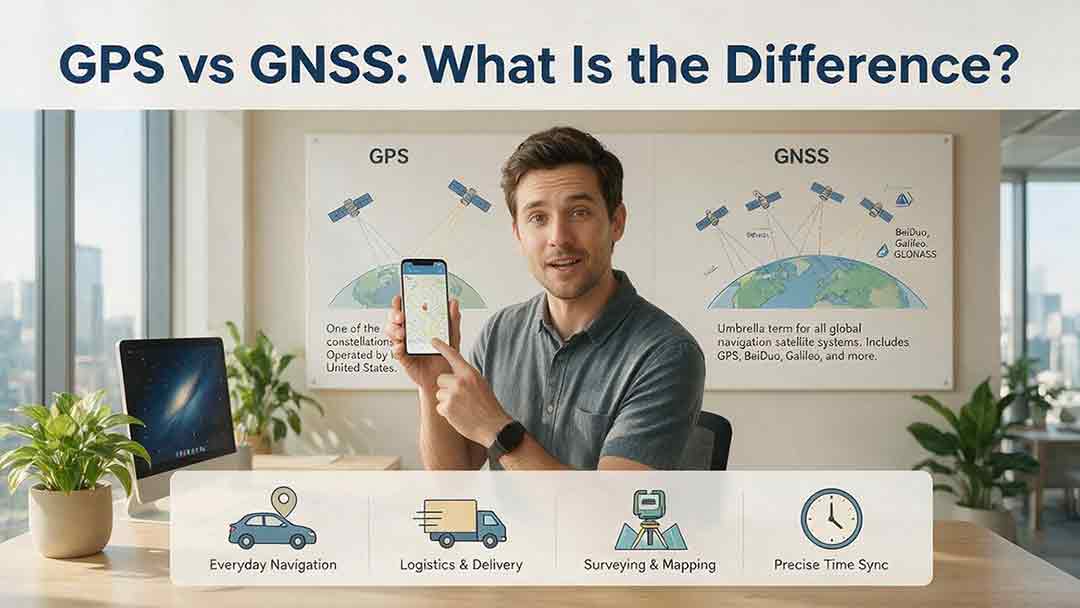
GPS vs GNSS: What Is the Difference?
GPS and GNSS are often used as if they mean the same thing, but they describe different levels of satellite navigation technology. GPS is the United States’ satellite navigation system, while GNSS is the broader category that includes GPS, Galileo, GLONASS, BeiDou, and compatible regional systems such as QZSS and NavIC. This guide explains how GPS-only and multi-GNSS receivers differ, why access to more constellations may improve signal availability, and why a larger satellite count does not automatically guarantee greater accuracy. It also examines dual-frequency reception, satellite geometry, antenna quality, correction services, sensor integration, and common positioning errors. Readers can use the Receiver Capability Stack, buying checklist, real-world examples, and troubleshooting steps to evaluate phones, watches, vehicle navigators, outdoor devices, survey receivers, and timing systems. The article is based on official technical documentation and clearly distinguishes educational examples from recognized GNSS performance standards.