How Do Satellites Measure Changes in Earth’s Climate?

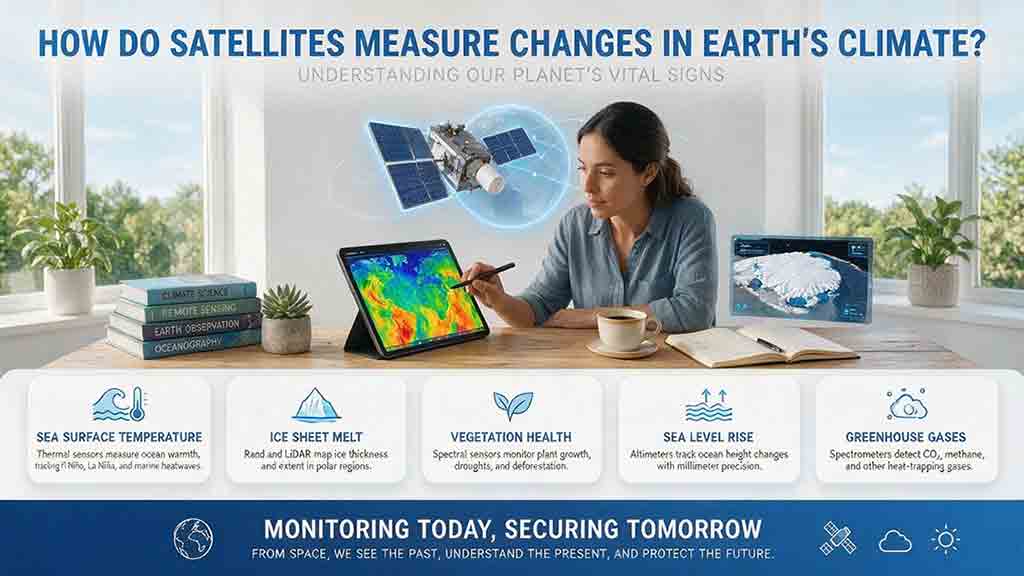
Satellites measure changes in Earth’s climate by repeatedly observing physical variables such as temperature, radiation, atmospheric gases, sea level, ice, water, and vegetation. Their instruments detect reflected light, emitted heat, microwave energy, radar or laser travel time, and gravity changes. Scientists calibrate and validate these observations before combining them into long-term climate records.
Key Takeaways
- Satellites measure physical signals related to climate rather than an abstract quantity called “climate change.”
- Different instruments measure energy, temperature, gases, surface height, motion, moisture, and mass change.
- Reliable climate records depend on calibration, mission continuity, validation, consistent processing, and uncertainty analysis.
- A single image shows conditions during a limited period; climate conclusions require repeated observations over time.
This guide explains what climate satellites actually detect, how raw measurements become scientific conclusions, and how to evaluate satellite maps without confusing short-term weather, indirect estimates, missing observations, or processing differences with long-term evidence.
How Do Satellites Actually Detect Climate Change?
Satellites detect climate change by measuring environmental variables repeatedly and examining how those measurements change over time.
An instrument in orbit does not observe “climate change” as a single object. It records a physical signal associated with part of the Earth system.
That signal may be:
- sunlight reflected by clouds, ice, vegetation, soil, or water
- infrared energy emitted by Earth
- microwave radiation emitted by the atmosphere or surface
- light absorbed at wavelengths associated with particular gases
- the return time of a radar or laser pulse
- changes in gravity or surface motion
Scientists use physical models and processing algorithms to convert these signals into environmental variables such as atmospheric temperature, sea-surface height, carbon dioxide concentration, ice elevation, soil moisture, or land cover.
The Global Climate Observing System identifies a defined set of Essential Climate Variables—physical, chemical, biological, or linked variables that critically contribute to characterizing Earth’s climate.
These variables cover the atmosphere, oceans, land, cryosphere, water cycle, carbon cycle, and related systems.
Weather observations and climate records serve different purposes
A weather satellite may help track a storm developing today. A climate record must remain sufficiently consistent to identify persistent changes across years or decades.
An apparent trend can be affected by changes in:
- the instrument or sensor sensitivity
- the satellite’s orbit
- local observation time
- geographic coverage
- cloud screening
- calibration or processing methods
A useful climate record is therefore more than an archive of images. It is a traceable measurement system designed to separate changes in Earth from changes in the observing equipment.
Which Climate Variables Can Satellites Measure?
Satellites can observe many of the variables scientists use to study Earth’s climate system.
| Climate variable | Signal detected | Typical use |
|---|---|---|
| Earth’s radiation budget | Reflected sunlight and emitted heat | Measuring energy entering and leaving Earth |
| Atmospheric temperature | Microwave or infrared radiation | Tracking temperature in atmospheric layers |
| Surface temperature | Thermal infrared or microwave emission | Monitoring land and sea-surface conditions |
| Greenhouse gases | Wavelength-specific absorption | Estimating carbon dioxide, methane, and other gases |
| Sea level | Radar pulse travel time | Measuring sea-surface height |
| Ice elevation | Laser or radar travel time | Detecting changes in glaciers and ice sheets |
| Water and ice mass | Variations in Earth’s gravity field | Estimating ice loss, groundwater change, and ocean mass |
| Sea ice and snow | Microwave emission, reflection, or radar response | Mapping extent, concentration, and seasonal change |
| Clouds and aerosols | Reflected light, heat, polarization, or laser returns | Studying clouds and atmospheric particles |
| Vegetation and land cover | Spectral reflectance | Mapping forests, crops, fires, and urban growth |
| Soil moisture | Microwave emission or radar response | Monitoring drought and water-cycle conditions |
| Ocean color | Visible-light reflectance | Estimating chlorophyll and phytoplankton patterns |
NASA provides a broader explanation of these observation priorities in its Essential Variables guide.
Direct measurements and retrieved variables are not the same
Some quantities are closely connected to the signal being recorded. A radar altimeter, for example, measures pulse travel time to estimate distance.
Other quantities require more interpretation.
A retrieval algorithm is a mathematical procedure that converts a measured signal into an estimated environmental variable.
A retrieval may account for:
- clouds and aerosols
- surface brightness and emissivity
- atmospheric absorption
- viewing and solar angles
- air pressure and temperature
- instrument noise
- interference from other variables
A satellite-derived temperature, gas concentration, or soil-moisture value is therefore usually a processed scientific estimate with an associated uncertainty—not an untouched number read directly from the detector.
The Signal-to-Claim Chain
This is a CosmoBasics reader framework, not an official agency assessment system.
The Signal-to-Claim Chain helps readers examine how a satellite observation becomes a public climate conclusion.
1. Signal
What did the instrument physically detect?
The signal might be reflected light, emitted microwave energy, an absorption feature, a radar echo, a laser return, or a change in satellite separation.
2. Retrieval
How was the signal converted into temperature, concentration, height, moisture, or mass?
The retrieval method should be documented and appropriate for the instrument, environment, and intended variable.
3. Correction
Which known influences were removed or adjusted?
Depending on the measurement, corrections may address clouds, atmospheric gases, tides, orbit errors, instrument drift, viewing geometry, or surface conditions.
4. Continuity
How was the record maintained when satellites or sensors changed?
Long records may require overlapping missions, cross-calibration, harmonized algorithms, and reprocessing of earlier observations.
5. Validation
Was the result compared with independent measurements?
Reference observations may come from weather stations, ocean buoys, tide gauges, aircraft, balloons, field surveys, ground instruments, or other satellites.
6. Claim
What does the final conclusion actually cover?
A responsible claim should identify:
- the measured variable
- geographic area
- observation period
- data product and version
- processing method
- uncertainty
- important limitations
Scientific conclusions do not emerge directly from the appearance of a satellite image. They come from a chain of measurement, retrieval, correction, continuity work, validation, and statistical interpretation.
If a claim does not identify the variable, observation period, data product, or uncertainty, readers may not have enough information to evaluate it responsibly.
From Raw Signals to Climate Records
A climate data record is a consistently processed time series designed to support analysis of climate variability and long-term change.
NOAA’s Climate Data Records program develops scientifically evaluated records intended to provide the longevity, consistency, and continuity needed for climate analysis.
Creating such a record generally involves seven stages.
Step 1: Record the physical signal
A detector may record radiance, pulse travel time, frequency, phase, polarization, or another measurable property.
Radiance describes electromagnetic energy arriving from a particular direction through a defined area and range of viewing angles.
At this stage, the observations may consist mainly of electronic counts, timing measurements, and engineering information.
Step 2: Assign a location and time
Scientists use the spacecraft’s position, instrument orientation, orbital information, and viewing geometry to determine where and when the observation occurred.
Accurate geolocation matters. An error could place a coastal measurement over land, shift an apparent glacier boundary, or assign a land-cover observation to the wrong field.
Step 3: Calibrate the instrument
Calibration connects the sensor’s electronic output to a known physical quantity.
References may include:
- onboard lamps or targets
- views of deep space
- the Sun or Moon
- stable desert, ocean, or ice sites
- aircraft and ground instruments
- simultaneous observations from another satellite
Calibration continues after launch because instruments can change through aging, radiation exposure, contamination, temperature cycling, and component wear.
The USGS Landsat Calibration and Validation program explains how preflight testing, onboard references, ground measurements, and continuing performance checks support consistency across the Landsat archive.
Step 4: Correct known observational effects
Processing may account for atmospheric absorption, scattering, cloud contamination, terrain, illumination, viewing geometry, orbital change, detector degradation, and differences between instruments.
The required corrections depend on the measurement method. A radar altimeter, infrared imager, and greenhouse gas spectrometer do not observe the same signal and cannot use the same processing chain.
Step 5: Produce the environmental variable
The corrected signal is converted into a product such as temperature, sea-surface height, gas concentration, ice elevation, vegetation condition, soil moisture, or surface reflectance.
Some products use one instrument. Others combine several wavelength channels, atmospheric information, physical models, or supporting observations.
Step 6: Harmonize successive missions
A single spacecraft rarely provides an uninterrupted record covering many decades.
Replacement instruments may differ in wavelength response, spatial resolution, calibration, viewing geometry, observation time, and noise characteristics.
Periods in which old and new missions operate together help scientists identify systematic differences. Earlier observations may later be reprocessed so the complete record uses more consistent methods.
Step 7: Validate the product
Validation evaluates how well a satellite product represents the physical variable it is intended to describe.
Comparisons may use:
- surface weather stations
- weather balloons
- ocean buoys and tide gauges
- ships and aircraft
- field measurements
- ground-based spectrometers
- independent satellite observations
Scientists cannot place a reference instrument beneath every satellite pixel. Instead, they use suitable test locations, field campaigns, statistical comparisons, and uncertainty analyses to characterize product performance.
Choosing the Right Measurement Method
No single satellite instrument is best for every climate question.
| Measurement method | Main strength | Main limitation |
|---|---|---|
| Visible and near-infrared imaging | Detailed land, vegetation, snow, and ocean-color mapping | Requires daylight and is blocked by clouds |
| Thermal infrared sensing | Measures emitted energy from surfaces and clouds | Clouds often obscure the surface |
| Passive microwave sensing | Works day and night through many clouds | Usually provides coarser spatial detail |
| Active radar | Works without sunlight and often through clouds | Response depends on moisture, roughness, and geometry |
| Laser altimetry and lidar | Precise height or vertical-profile measurements | Clouds and aerosols can reduce coverage |
| Radar altimetry | Repeated measurements of ocean and ice height | Requires precise orbital and environmental corrections |
| Spectroscopy | Identifies gases through wavelength-specific absorption | Clouds, aerosols, and surface brightness affect retrievals |
| Gravity mapping | Detects large-scale redistribution of mass | Mixed mass sources and limited spatial resolution |
| Radio occultation | Produces stable atmospheric profiles | Samples narrow paths rather than complete images |
The central measurement trade-off
A satellite mission generally cannot maximize every useful characteristic at once.
Spatial resolution is the physical area represented by an observation.
Temporal resolution is how frequently a location is observed.
Scientists may also consider spectral resolution, radiometric sensitivity, geographic coverage, record length, and mission continuity.
A sensor with smaller pixels is not automatically more suitable for climate analysis. A coarser dataset with stable calibration and decades of consistent coverage may provide stronger evidence of a long-term trend.
Measuring Earth’s Energy Balance
Satellites measure Earth’s energy balance by observing reflected solar radiation and thermal energy emitted to space.
The balance between absorbed sunlight and outgoing heat influences temperatures, ocean heat storage, ice, atmospheric circulation, and the water cycle.
NASA’s Clouds and the Earth’s Radiant Energy System, or CERES, uses broadband radiometers and supporting observations to produce records of:
- reflected shortwave solar radiation
- outgoing thermal infrared radiation
- cloud properties that affect energy flows
- radiation at the top of the atmosphere and near the surface
The climate-relevant difference between incoming and outgoing energy is small compared with the total amount of energy moving through the system.
Detecting persistent change therefore requires stable instruments, careful calibration, broad geographic sampling, and comparisons with other parts of the climate system.
Measuring Atmospheric and Surface Temperature
Satellite temperature products do not all represent the same physical quantity.
Atmospheric temperature
Microwave and infrared sounders measure radiation influenced by temperature, moisture, gases, clouds, and altitude.
A reported atmospheric temperature may represent a thick vertical layer rather than one exact height.
Long-term records may require adjustments for:
- calibration drift
- differences between instruments
- orbital drift
- changing observation times
- viewing-angle effects
- channel-frequency differences
The NOAA Mean Layer Temperature Climate Data Record combines observations from several generations of microwave sounders and applies corrections intended to improve consistency across instruments.
Surface temperature
Thermal infrared instruments estimate the temperature of the surface emitting the observed radiation.
That surface might be an ocean skin layer, bare soil, vegetation, a roof, snow, or sea ice.
Satellite land-surface temperature is not the same as the near-surface air temperature recorded by a weather station. Both measurements can be useful, but they answer different questions.
Brightness temperature
Brightness temperature is the temperature a perfect emitter would need to produce the observed radiation at a specified wavelength or frequency.
It may differ from the physical temperature of the real surface, cloud, or atmospheric layer because real materials do not emit energy perfectly and because the atmosphere can alter the signal.
A Complete Signal-to-Claim Example: Sea-Level Change
Satellite altimetry provides a clear example of how a physical observation becomes a climate conclusion.
1. Transmit a radar pulse
A radar altimeter sends microwave energy toward the ocean surface.
2. Measure the return time
Part of the pulse reflects from the ocean and returns to the spacecraft.
The round-trip travel time is used to estimate the distance between the satellite and the sea surface.
3. Determine the satellite’s orbital height
Distance to the water is only one part of the calculation.
Scientists also need precise information about the spacecraft’s position relative to a stable terrestrial reference frame.
NASA’s explanation of satellite sea-level measurement emphasizes that radar altimetry depends on accurate timing, precise orbital knowledge, and extensive calibration.
4. Apply environmental corrections
Sea-surface height processing may account for:
- atmospheric water vapor
- dry atmospheric gases
- electrons in the ionosphere
- ocean waves
- tides
- atmospheric pressure
- instrument and orbit uncertainty
These factors can alter the radar pulse path or the apparent height of the ocean.
5. Check measurement quality
Observations affected by land contamination, instrument problems, failed corrections, or unsuitable surface conditions may be flagged or excluded.
6. Align successive missions
A long sea-level record normally combines measurements from several altimetry missions.
Overlap periods and cross-calibration help reduce artificial steps when one mission replaces another.
NASA’s Integrated Multi-Mission Ocean Altimeter Data for Climate Research, Version 6.0 is an example of measurements from successive missions being referenced and processed as a coordinated dataset.
7. Calculate regional and global averages
Individual measurements are aggregated over defined areas and time periods.
The calculation must account for incomplete coverage, spatial weighting, sampling differences, missing observations, and regional ocean variability.
8. Report a trend and uncertainty
The final conclusion is a statistical estimate covering a stated geographic area and observation period.
It is not a single reading produced by one radar pulse.
Editorial observation: “Satellites detected a change in sea level” is useful shorthand, but the underlying conclusion depends on radar ranging, orbit determination, atmospheric and tidal corrections, quality control, cross-mission calibration, spatial averaging, and uncertainty analysis.
Measuring Changes in Ice
Scientists use several complementary methods because ice can change in area, elevation, speed, density, and total mass.
Laser and radar altimetry measure elevation
NASA’s ICESat-2 mission carries a photon-counting laser altimeter that measures the elevation of ice sheets, glaciers, sea ice, land, and vegetation.
Repeated observations can show where an ice surface has risen or fallen.
Elevation change does not automatically equal an identical change in ice mass. Interpretation may also require information about snowfall, melting, snow density, firn compaction, bedrock movement, and ice flow.
Radar imagery measures motion and surface change
Synthetic aperture radar can observe ice during darkness and through many cloud conditions.
Comparing radar observations can help estimate glacier speed, ice displacement, grounding-line movement, surface deformation, and changes in ice extent.
Gravity missions estimate mass redistribution
The GRACE and GRACE Follow-On missions measure variations in Earth’s gravity field through extremely small changes in the distance between paired satellites.
These observations can reveal large-scale changes in:
- ice-sheet mass
- groundwater
- terrestrial water storage
- ocean mass
A gravity change does not identify one source automatically. Ice, groundwater, soil water, oceans, and solid-Earth processes may all contribute.
Scientists generally use additional observations and physical models to separate these influences.
Measuring Greenhouse Gases
Satellite spectrometers estimate greenhouse gas concentrations by measuring how gases absorb particular wavelengths of light.
NASA’s Orbiting Carbon Observatory-2 spectrometer measures reflected sunlight in wavelength bands associated with carbon dioxide and molecular oxygen.
These observations can help researchers examine:
- seasonal carbon cycles
- regional concentration patterns
- atmospheric transport
- large emission plumes
- land and ocean carbon exchange
Concentration, however, is not the same as an emission rate.
A concentration observed above a region may be influenced by nearby emissions, distant emissions transported by wind, natural sources, biological uptake, vertical mixing, and background atmospheric conditions.
Estimating a source or sink generally requires repeated observations, atmospheric transport models, weather information, and supporting ground or aircraft measurements.
Clouds, aerosols, surface brightness, sunlight, and viewing geometry may also limit individual retrievals.
Measuring Land, Vegetation, and Water-Cycle Change
Multispectral satellites distinguish surfaces by measuring how strongly they reflect different wavelengths.
Water, healthy vegetation, dry vegetation, soil, snow, burned land, and built surfaces have different spectral patterns.
Scientists use these differences to study:
- forest loss and regrowth
- agricultural change
- urban expansion
- wetland change
- wildfire effects
- surface-water variation
- vegetation seasonality
The Landsat archive is valuable for long-term land analysis because calibration and mission continuity support comparisons across several generations of instruments.
The USGS provides independent reference and validation information for its Annual National Land Cover Database products, allowing users to examine how well mapped land-cover classes agree with separately interpreted reference observations.
Greenness is not the same as ecosystem health
A vegetation index may indicate increased leaf activity or stronger reflectance in vegetation-sensitive wavelengths.
It does not automatically prove that biodiversity improved, carbon storage increased, water availability improved, land degradation ended, or an ecosystem became healthier.
Greenness can be influenced by crop cycles, irrigation, invasive plants, fire recovery, seasonal timing, cloud contamination, and sensor characteristics.
From Measurements to Climate Trends
Scientists identify climate trends by creating consistent time series, controlling for known observation changes, estimating uncertainty, and comparing independent records.
A typical analysis may involve:
- choosing a suitable data product
- recording the product version
- applying quality flags
- creating daily, monthly, or annual averages
- accounting for seasonal cycles
- calculating anomalies
- addressing instrument or sampling changes
- estimating uncertainty
- comparing independent datasets
Why climate analyses use anomalies
An anomaly is the difference between an observation and an average calculated over a stated reference period.
Consider this hypothetical example:
- Reference-period July sea-surface temperature: 26.8°C
- July temperature in an example year: 27.4°C
The anomaly would be:
27.4°C − 26.8°C = +0.6°C
This is an illustrative calculation, not an observed result or an original climate dataset.
Anomalies help show how conditions differ from the typical seasonal climate at each location. The result still depends on the baseline period, dataset, geographic boundaries, and quality-control method.
Why geographic weighting matters
Latitude–longitude grid cells do not all represent the same surface area. Cells near the poles generally cover less area than cells of the same angular size near the equator.
Consider another simplified example:
- Equatorial anomaly: +1.0°C
- Anomaly at 60° north: +2.0°C
Using cosine-of-latitude weighting:
- Equatorial weight: cos(0°) = 1
- Weight at 60°: cos(60°) = 0.5
Weighted mean:
[(1.0 × 1) + (2.0 × 0.5)] ÷ (1 + 0.5) = 1.33°C
A simple unweighted average would produce 1.5°C.
This illustrative calculation shows why the method used to aggregate map cells can affect a regional or global result.
How Do Scientists Separate Climate Change From Weather?
Scientists distinguish long-term climate change from weather by examining persistent patterns across sufficiently long and consistent records.
One unusual storm, heat wave, cold month, wildfire season, or low-ice year does not establish a long-term trend by itself.
Stronger evidence includes:
- changes that persist across many years
- similar findings in independent datasets
- agreement among different instrument types
- geographic patterns consistent with physical processes
- related changes across several parts of the Earth system
- results that remain after known observation problems are addressed
A sea-level assessment, for example, may compare sea-surface height from radar altimeters, ocean mass from gravity missions, ocean temperature from profiling floats, ice-sheet changes from separate satellites, and coastal measurements from tide gauges.
Independent methods do not need to produce identical values. They should form a physically compatible picture once differences in coverage, resolution, measured variables, and uncertainty are considered.
Why Satellite Climate Maps Sometimes Disagree
Two maps may both be scientifically valid while displaying different values.
| Difference | What to check | Why it matters |
|---|---|---|
| Variable | Surface, air, layer, or brightness temperature? | The maps may represent different quantities |
| Units | Celsius, kelvin, concentration, height, or anomaly? | Similar colors may conceal different measurements |
| Time period | Daily, monthly, seasonal, or annual? | Short periods contain more weather variability |
| Baseline | Which years define the anomaly? | Different baselines change anomaly values |
| Resolution | What area does each pixel represent? | Coarser data smooth local variation |
| Observation time | Morning, afternoon, or composite? | Conditions change during the day |
| Cloud screening | How were cloudy or uncertain pixels handled? | Coverage and averages may differ |
| Product version | Was one record reprocessed? | Updated methods can revise historical values |
| Geographic mask | Which coastal, land, ocean, or ice areas were included? | Regional averages may change |
| Quality rules | Were low-confidence observations removed? | Filtering affects coverage and results |
Before comparing maps, identify the exact product name, measured variable, units, observation period, anomaly baseline, processing version, geographic coverage, quality flags, and uncertainty information.
Visual similarity—or disagreement—does not establish that two maps are measuring the same quantity.
The Main Limits of Satellite Climate Data
Satellite observations provide broad and repeated coverage, but every measurement system has limitations.
Many variables are estimated indirectly
Satellites often detect radiation or pulse returns rather than the final environmental quantity shown on a map.
The result depends on retrieval algorithms, assumptions, supporting information, and correction procedures.
Clouds create gaps
Visible and thermal infrared instruments usually cannot observe the surface through thick clouds.
Microwave sensors can work through many cloud conditions, but they may provide coarser detail and can still be affected by precipitation, surface moisture, or interference.
Sensor changes can introduce artificial shifts
A replacement instrument may have a different wavelength response, calibration, resolution, or observation time.
Without harmonization, an instrument change could resemble an environmental trend.
Orbital drift changes sampling conditions
Some satellites are designed to cross a location at approximately the same local time.
If that time changes, the sensor may begin observing systematically earlier or later in the day. Variables with strong daily cycles can be especially sensitive to this effect.
Coverage may be incomplete
Measurements may be unavailable because of clouds, darkness, instrument outages, narrow swaths, surface glare, aerosols, failed retrievals, or quality filtering.
A visually complete map may include interpolation, model output, or combined observations rather than direct measurements in every location.
Fine resolution does not guarantee climate quality
A detailed image may be excellent for mapping a field, neighborhood, or glacier edge.
Long-term climate analysis also requires sensor stability, calibration, mission continuity, consistent processing, metadata, uncertainty estimates, and reliable sampling.
The smallest pixel is not always the strongest basis for detecting a long-term trend.
Common Satellite Climate Data Misinterpretations
1. Confusing related variables
Surface temperature is not near-surface air temperature.
A satellite may measure the temperature of soil, vegetation, roofs, snow, ice, or the ocean skin layer. A weather station generally measures air temperature above the ground.
Brightness temperature is not always physical temperature.
Its relationship to physical temperature depends on wavelength, emissivity, atmospheric conditions, and the observed material.
Gas concentration is not emission rate.
A carbon dioxide concentration may reflect local emissions, distant transport, natural sources, background conditions, and atmospheric mixing.
Ice elevation change is not automatically ice-mass change.
Snowfall, compaction, bedrock movement, density, melting, and ice flow can all affect surface elevation.
2. Confusing time periods or baselines
A daily image cannot establish a multi-decadal trend.
Anomaly maps using different reference periods may show different values even when they describe the same observations.
Daily, monthly, seasonal, and annual products should not be treated as interchangeable.
3. Misreading missing observations
A blank area may indicate:
- cloud cover
- darkness
- failed retrieval
- an instrument outage
- unsuitable viewing geometry
- quality filtering
It does not necessarily indicate normal, unchanged, or zero conditions.
A map that appears complete may contain interpolation or model-assisted values. Product documentation should explain how gaps were handled.
4. Making unsupported attribution claims
Correlation does not by itself establish cause.
A concentration increase does not automatically identify one emission source. A gravity change does not automatically reveal whether the changing mass came from ice, groundwater, soil water, or the ocean.
Attribution generally requires additional observations, physical analysis, and models.
5. Applying regional data to a specific site
A regional satellite product may not represent one building, property, farm, road, or section of coastline.
Satellite observations should not normally be used alone to:
- determine the flood risk of one building
- replace a site-specific engineering survey
- establish a legal property boundary
- assign legal responsibility for land-cover change
- determine regulatory compliance
- evaluate field-level agricultural conditions
Important local decisions should combine satellite information with field measurements, local agency records, applicable regulations, site-specific surveys, and qualified professional advice.
The 4C Climate-Record Test
Use the 4C test before relying on a satellite-based climate chart, headline, dataset, or social-media map.
This is a CosmoBasics reader framework, not an official agency assessment system.
1. Coverage
Is every region in the map based on a direct observation?
Check:
- which areas were observed
- how clouds and darkness were handled
- whether gaps were interpolated
- how often each location was sampled
- whether measurements and models were combined
A global-looking map does not necessarily contain direct observations everywhere.
2. Continuity
Does the record extend consistently across several satellite generations?
Check:
- start and end dates
- instrument transitions
- overlap between missions
- known data gaps
- changing observation times
A record can be long without being internally consistent.
3. Calibration
Were sensor aging, orbital changes, and instrument differences addressed?
Check:
- onboard calibration systems
- cross-calibration with other instruments
- ground or aircraft comparisons
- corrections for sensor degradation
- changes between product versions
A sensor may continue producing plausible images even while its sensitivity changes gradually.
4. Cross-checking
Do independent observations show a compatible pattern?
Look for comparisons with:
- ground stations
- ocean buoys
- tide gauges
- weather balloons
- aircraft
- field surveys
- independent satellites
Agreement does not eliminate uncertainty, but it reduces the likelihood that a result comes from one instrument or processing error.
How to Choose a Satellite Climate Dataset
The best dataset depends on the question, not on which map looks most detailed.
Step 1: Define the variable precisely
Do not begin with a broad request such as “satellite temperature data.”
Specify whether you need land-surface temperature, sea-surface temperature, near-surface air temperature, atmospheric-layer temperature, a daily value, or a monthly anomaly.
Similar product names may describe different physical quantities.
Step 2: Separate weather use from climate use
A near-real-time operational product may be suitable for monitoring a current storm, fire, flood, or heat event.
A multi-year analysis should use a documented record designed for long-term consistency.
Step 3: Match resolution to the question
A global trend analysis and a local land-management study require different spatial detail.
A high-resolution product may have less frequent coverage, a shorter record, more cloud-related gaps, or less continuity between instruments.
Step 4: Check the record and version history
Record:
- dataset name and version
- production date
- observation period
- mission transitions
- known gaps
- algorithm changes
- reprocessing notices
Do not merge different products or versions without confirming that they are compatible.
Step 5: Review quality and uncertainty information
Useful products may include quality flags, retrieval confidence, cloud masks, missing-data codes, uncertainty fields, and calibration documentation.
A displayed map without metadata is rarely enough for quantitative analysis.
Step 6: Compare an independent source
For an important conclusion, compare the result with at least one suitable independent source.
That source may be another satellite product, a station network, tide gauges, ocean buoys, a field dataset, a validation study, or an authoritative scientific assessment.
What Satellite Climate Measurements Tell Us
Satellites provide repeated observations of Earth’s atmosphere, oceans, land, ice, water, and energy flows across regions that would be difficult to monitor from the ground alone.
Their greatest strength is broad, repeated coverage. Their central challenge is that many climate variables must be estimated from physical signals and maintained across changing instruments, missions, algorithms, and observation conditions.
The most reliable interpretation begins by identifying the exact variable, dataset version, time period, processing method, and uncertainty—not by judging the appearance of a satellite map alone.
Frequently Asked Questions
Do satellites measure climate directly?
No single sensor measures “climate” as one quantity.
Satellites measure physical signals associated with variables such as temperature, radiation, atmospheric composition, sea level, ice, moisture, and vegetation. Long-term climate conclusions are produced by processing and comparing repeated observations.
Are satellite measurements more accurate than weather stations?
Neither system is universally more accurate.
Weather stations provide direct measurements at particular locations. Satellites provide broad geographic coverage but often estimate variables indirectly.
Climate analyses frequently use both because they provide complementary information.
How long must a satellite record be to show climate change?
There is no universal minimum period.
The required record length depends on the size of the trend, natural variability, geographic scale, seasonal behavior, measurement uncertainty, and stability of the observing system.
A large change may become detectable sooner than a smaller trend surrounded by substantial short-term variability.
How can climate records continue when individual satellites stop working?
Climate programs use sequences of missions.
Scientists may overlap old and new instruments, compare simultaneous observations, estimate systematic differences, harmonize processing, and reprocess earlier data when calibration knowledge improves.
The continuity of the observing system is more important than the lifespan of one spacecraft.
Why do historical satellite values sometimes change?
A dataset may be reprocessed after scientists improve calibration, orbital corrections, cloud screening, retrieval algorithms, or supporting reference data.
A revised value does not automatically mean the original observation was false. It may represent an improved estimate produced from the same underlying measurements.
Technical users should record the exact product version used in an analysis.
Can satellite data prove what caused a climate trend?
Satellite observations can provide evidence of where, when, and how a variable changed, but one dataset rarely establishes cause by itself.
Attribution generally requires physical understanding, independent observations, statistical analysis, and often climate or atmospheric models.
Editorial Method and Limitations
This article was developed primarily from official mission, instrument, calibration, validation, and climate-record documentation published by NASA, NOAA, ESA, USGS, WMO, and GCOS.
The review distinguished raw sensor signals from retrieved environmental variables and long-term climate records. Mission descriptions and measurement methods were checked against first-party technical or data-product pages where available. Indirect observations were not presented as unprocessed direct measurements, and the numerical examples were labeled as hypothetical illustrations rather than observed climate data.
The Signal-to-Claim Chain and 4C Climate-Record Test are reader frameworks intended to support evidence evaluation; they are not official scientific standards. This article has not undergone independent academic peer review. Data products, algorithm versions, mission status, and URLs may change, so technical users should consult the documentation for the exact product and version they intend to use.
Sources
NASA Earthdata — Essential Variables
Overview of variables used to monitor Earth’s atmosphere, oceans, land, and related systems.Global Climate Observing System — Essential Climate Variables
Definitions, selection criteria, observation requirements, and climate-monitoring principles.NOAA National Centers for Environmental Information — Climate Data Records
Explanation of fundamental and thematic climate records, continuity, quality assessment, and data access.NOAA — Mean Layer Temperature Climate Data Record, Version 5
Atmospheric layer-temperature record derived from successive microwave sounding instruments.
DOI: 10.25921/tn91-wv50NASA CERES — Clouds and the Earth’s Radiant Energy System
Official information about satellite observations of Earth’s radiation budget and clouds.USGS — Landsat Calibration and Validation
Information about preflight and on-orbit calibration, ground reference measurements, sensor performance, and continuing validation.NASA Sea Level Change Portal — How Satellites Measure Sea-Level Change
Explanation of radar altimetry, pulse timing, orbital knowledge, terrestrial reference frames, and calibration.NASA PO.DAAC — Integrated Multi-Mission Ocean Altimeter Data for Climate Research, Version 6.0
Harmonized sea-surface-height anomalies from successive altimetry missions.
DOI: 10.5067/ALTCY-TJA60NASA Earthdata — ICESat-2
Mission information for photon-counting laser measurements of ice, land, sea ice, and vegetation elevation.NASA Earthdata — GRACE and GRACE Follow-On
Official description of satellite gravity measurements and Earth-system mass change.NASA Earthdata — GRACE-FO Documentation
Technical handbooks, processing standards, release notes, and product documentation.NASA Earthdata — OCO-2 Spectrometer
Instrument documentation for carbon dioxide and molecular oxygen absorption measurements.USGS — Annual National Land Cover Database Collection 1.0 Validation Tables
Independent reference and validation information for annual land-cover products.
DOI: 10.5066/P1KJXXGAESA Climate Change Initiative — Essential Climate Variables
Information about long-term satellite-derived climate data records developed for major components of the climate system.
More from Earth Observation & Mapping
How Do Satellites Detect Wildfires and Smoke?
Satellites detect wildfires by measuring unusual heat in infrared wavelengths, while visible, multispectral, and aerosol observations help analysts follow smoke across the atmosphere. This guide explains how systems such as GOES, VIIRS, MODIS, Landsat, and Sentinel contribute different pieces of the wildfire-monitoring picture. Readers will learn why a thermal hotspot is not the same as an exact fire perimeter, why satellite smoke imagery cannot replace ground-level PM2.5 measurements, and how clouds, terrain, viewing geometry, and satellite overpass timing can affect detection. The article also compares commonly used fire and smoke products, explains fire radiative power and the Normalized Burn Ratio, and provides a practical framework for choosing the right map. A documented Camp Fire example shows how multiple satellite and surface datasets can complement one another. Satellite information is valuable for situational awareness, but official emergency agencies remain the appropriate source for evacuation orders, road closures, and immediate safety decisions.
How Are Satellite Images Used in Agriculture?
Satellite images help farmers, agronomists, researchers, insurers, and public agencies monitor agricultural land across fields, regions, and growing seasons. This guide explains how optical, radar, thermal, and microwave satellite observations support crop-development monitoring, irrigation analysis, field mapping, flood and drought assessment, crop classification, and regional production forecasting. It distinguishes what satellites directly observe from calculated indices, classification results, and modeled estimates such as evapotranspiration. Readers will also learn how NDVI works, why spatial resolution and image timing matter, and when drones or field scouting are more appropriate. The original CosmoBasics SCALE Framework provides a practical way to decide whether satellite imagery fits a specific agricultural problem. Documented examples from USDA and OpenET show how operational products combine multiple observations, reference data, weather information, and models. Throughout the guide, satellite imagery is treated as a screening and monitoring tool—not a substitute for field verification, laboratory testing, or professional agricultural judgment.
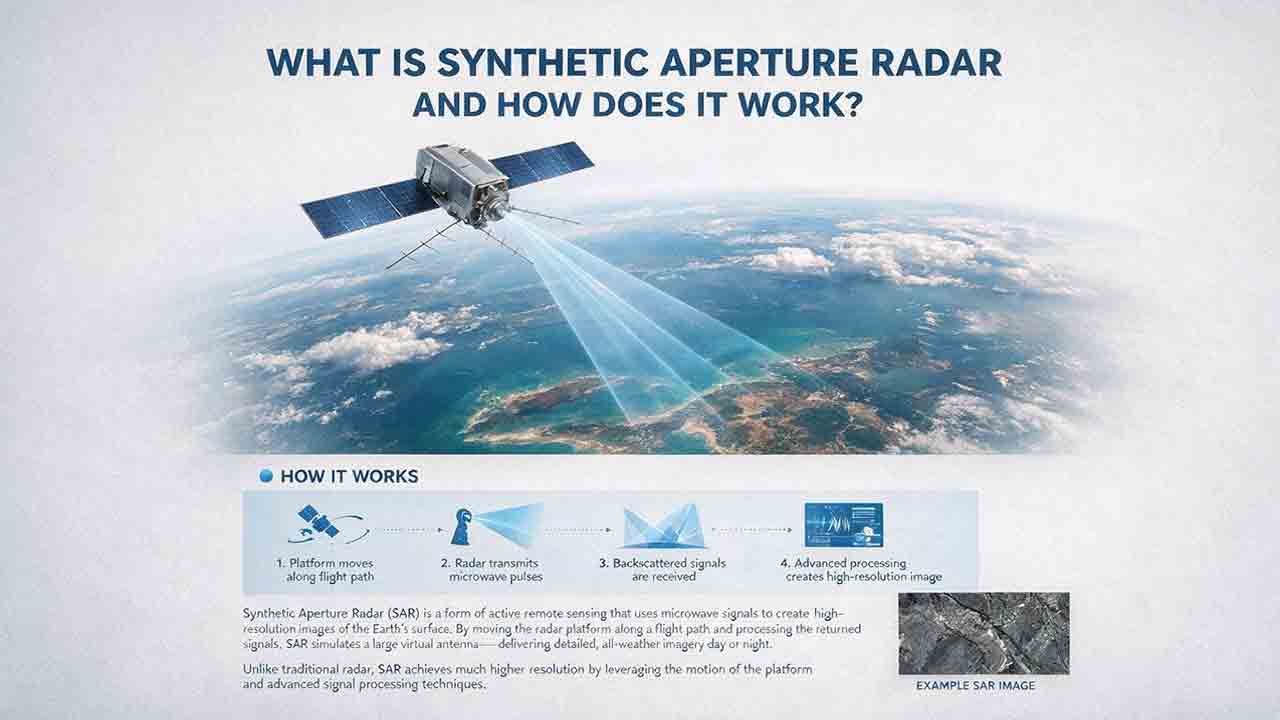
What Is Synthetic Aperture Radar and How Does It Work?
Synthetic aperture radar, or SAR, is an active Earth-observation technology that creates detailed images by transmitting microwave pulses and measuring the echoes returned from the surface. This article explains how a moving satellite or aircraft collects repeated observations to form a virtual antenna, why SAR can operate at night and through most cloud cover, and how amplitude, phase, wavelength, polarization, surface roughness, moisture, and viewing geometry affect radar imagery. It also distinguishes pixel spacing from true spatial resolution, provides a transparent range-resolution calculation, and compares SAR with optical satellite imagery. Practical sections examine scattering mechanisms, flood mapping, agriculture, forests, ice, maritime monitoring, and InSAR-based ground-deformation analysis. Original interpretation and data-selection frameworks help readers evaluate backscatter patterns, choose suitable products, identify common errors, troubleshoot unexpected results, and communicate uncertainty without treating derived radar products as guaranteed ground truth.
Explore More Topics
Why Does Your Phone Sometimes Show the Wrong Location?
A phone’s location can appear incorrect even when its GPS hardware is functioning normally. Modern smartphones estimate position by combining satellite signals with Wi-Fi, cellular networks, Bluetooth, motion sensors, app permissions, and map data. This guide explains how blocked or reflected signals, cached locations, approximate permissions, battery restrictions, compass errors, and inaccurate map pins can affect the blue dot. It introduces two practical CosmoBasics troubleshooting tools—the Two Apps, Two Places Rule and the PLACE Test—to help readers distinguish app problems, environmental interference, stale data, mapping errors, and possible device-level issues. The article also provides step-by-step fixes for iPhone and Android, explains realistic smartphone accuracy under open-sky and indoor conditions, and identifies when contacting the manufacturer may be appropriate. All major technical claims are supported by first-party documentation from GPS.gov, Apple, Android, Google Maps, and Google for Developers.
How Accurate Is Consumer GPS?
Consumer GPS can often estimate horizontal position within about 5 meters under open sky, but actual accuracy varies significantly with the device, satellite geometry, signal blockage, reflected signals, antenna placement, and software processing. This guide explains what GPS accuracy figures really mean, why an app’s accuracy circle is not the same as measured error, and why smartphone references, Android confidence estimates, and government GPS performance standards should not be treated as interchangeable. It introduces the CosmoBasics Target Separation Test, a practical framework for deciding whether GPS uncertainty is small enough for a specific task. Readers will also learn how smartphones combine GNSS, Wi-Fi, cellular data, and sensors; how dual-frequency reception may improve performance; why altitude is less reliable than horizontal position; and how to test and troubleshoot a device. The article clearly identifies situations where consumer GPS is useful and where professional, certified, or regulated positioning methods are necessary.
GPS vs GNSS: What Is the Difference?
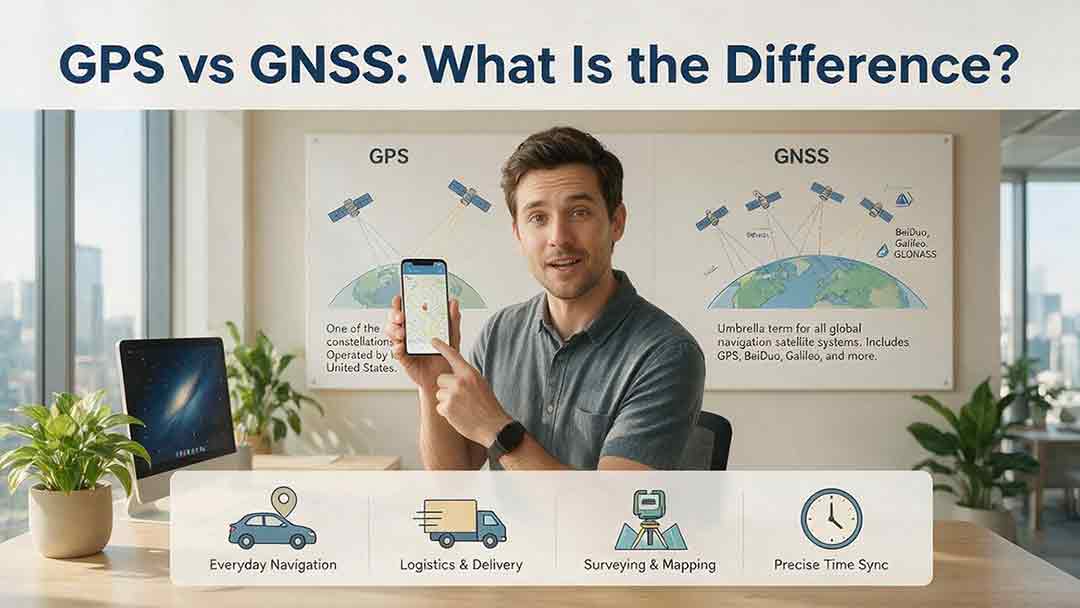
GPS and GNSS are often used as if they mean the same thing, but they describe different levels of satellite navigation technology. GPS is the United States’ satellite navigation system, while GNSS is the broader category that includes GPS, Galileo, GLONASS, BeiDou, and compatible regional systems such as QZSS and NavIC. This guide explains how GPS-only and multi-GNSS receivers differ, why access to more constellations may improve signal availability, and why a larger satellite count does not automatically guarantee greater accuracy. It also examines dual-frequency reception, satellite geometry, antenna quality, correction services, sensor integration, and common positioning errors. Readers can use the Receiver Capability Stack, buying checklist, real-world examples, and troubleshooting steps to evaluate phones, watches, vehicle navigators, outdoor devices, survey receivers, and timing systems. The article is based on official technical documentation and clearly distinguishes educational examples from recognized GNSS performance standards.