How Do Weather Satellites Track Hurricanes?

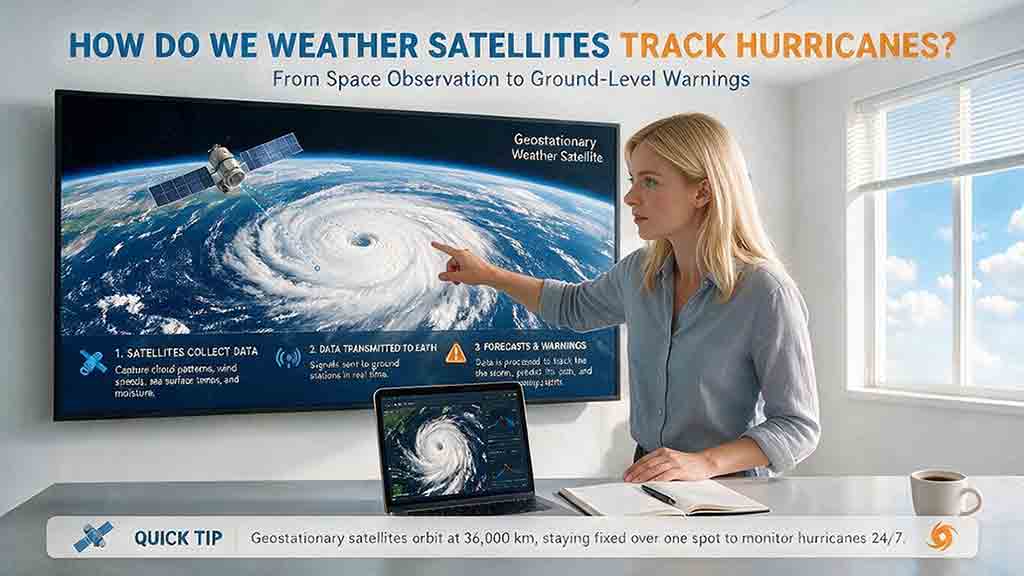
Weather satellites track hurricanes by repeatedly observing their location, cloud structure, temperature, moisture, rainfall, lightning, and surrounding environment. Geostationary satellites provide frequent regional imagery, while polar-orbiting satellites supply detailed snapshots from lower orbit. Forecasters combine these observations with aircraft, radar, buoys, ocean measurements, and computer models to estimate a hurricane’s present condition and predict its likely movement.
Key Takeaways
- Geostationary satellites are best for watching a hurricane move, organize, weaken, or change rapidly over minutes and hours.
- Polar-orbiting satellites provide detailed measurements of temperature, moisture, rainfall, surface winds, and hidden storm structure.
- Satellites measure radiation, radar backscatter, and other signals; algorithms then retrieve or estimate winds, rainfall, pressure, and related variables.
- Satellites observe the storm and its environment, while models and meteorologists produce official track and intensity forecasts.
- Confidence is generally greatest when several independent observing systems identify a similar center, structure, and intensity trend.
This guide explains how satellites locate hurricanes, reveal features hidden beneath upper clouds, support forecast models, and help readers choose the right imagery for a particular question.
Scope and methodology: This article was developed from NOAA, NASA, National Hurricane Center, and official satellite-program documentation. Technical statements were checked across mission specifications and operational tropical-cyclone resources. Its original value lies in the explanatory frameworks, educational calculation, product-selection tools, and independent synthesis—not in original satellite observations or independent forecast measurements.
Safety note: Satellite imagery is useful for education and situational awareness. Evacuation, shelter, travel, and other personal safety decisions should follow official forecasts, local warnings, and instructions from emergency-management authorities.
Contents
- How Hurricane Satellite Tracking Works
- Calculating a Hurricane’s Movement
- Geostationary vs. Polar-Orbiting Satellites
- What Satellite Instruments Measure
- How Satellites Estimate Hurricane Intensity
- How Satellites Support Forecasts
- The Observe–Measure–Model Framework
- Choosing the Right Satellite Product
- Hurricane Milton Case Study
- Limitations and Common Mistakes
- Practical Satellite-Image Checklist
- Frequently Asked Questions
- Sources
How Does Hurricane Satellite Tracking Work?
Hurricane tracking is a repeating evidence cycle, not a single photograph or sensor reading.
Different instruments answer different questions:
- Where is the circulation center?
- How quickly is the storm moving?
- Is the inner core becoming more organized?
- Where are the strongest winds and heaviest rainfall?
- Is wind shear disrupting the circulation?
- How much moisture and ocean heat surround the storm?
- Which atmospheric systems may steer it?
Forecasters repeat the following process throughout the storm’s life.
Step 1: Satellites Detect a Developing Disturbance
Meteorologists first monitor persistent clusters of thunderstorms over tropical and subtropical waters.
Visible, infrared, and water-vapor imagery may reveal:
- Curved cloud bands
- Broad rotation
- Persistent deep thunderstorms
- Increasing cloud organization
- Upper-level outflow
- Dry air near the disturbance
- Thunderstorms displaced by wind shear
A thunderstorm cluster is not automatically a tropical cyclone. Forecasters look for evidence that thunderstorms are becoming organized around a defined surface circulation and that the structure persists over time.
NOAA’s operational geostationary satellites continuously monitor much of the Western Hemisphere. As reviewed in August 2026, GOES-19 operates as GOES East and GOES-18 operates as GOES West.
Step 2: Forecasters Locate the Circulation Center
The circulation center is the reference point used to describe a tropical cyclone’s position and motion.
In a strong hurricane with a clear eye, the center may be obvious. In a weak, sheared, or reorganizing system, the low-level center may be hidden beneath high clouds or separated from the strongest thunderstorms.
Forecasters compare:
- Daylight visible imagery
- Day-and-night infrared imagery
- Microwave views of rainfall and inner-core structure
- Scatterometer wind retrievals
- Coastal and airborne radar
- Buoy, ship, and surface observations
- Hurricane Hunter aircraft measurements, when available
A new microwave image or scatterometer pass may show that the surface circulation is not directly beneath the highest or coldest clouds. Operational centers can then revise the estimated position.
Step 3: Repeated Center Fixes Reveal Motion
A sequence of center positions shows the hurricane’s direction and forward speed.
Forecasters normally compare several quality-controlled fixes rather than relying on only two points. A hurricane’s center can wobble, become temporarily difficult to identify, or relocate while the circulation reorganizes.
The basic process is:
- Identify the center at several observation times.
- Calculate the distance between positions.
- Divide the distance by elapsed time.
- Compare short-term movement with the broader track.
- Check whether other instruments support the same center.
Step 4: Frequent Images Reveal Structural Changes
A hurricane is not a rigid object. Its eye, eyewall, rainbands, cloud shield, and upper-level outflow continually evolve.
Forecasters watch for:
- Formation or clearing of an eye
- Eye contraction or expansion
- Cloud-top cooling near the center
- Thunderstorms wrapping around the circulation
- Gaps in the eyewall
- Concentric eyewalls
- Displacement caused by wind shear
- Dry-air intrusions
- Lightning bursts
- Changes in upper-level outflow
GOES-R satellites orbit approximately 22,236 miles above the equator and continuously view the same broad geographic region. Their Advanced Baseline Imager can provide targeted storm imagery as frequently as about every 30 seconds under the appropriate mesoscale scanning configuration.
Step 5: Algorithms Convert Signals Into Weather Variables
Satellite instruments first record physical signals such as reflected sunlight, infrared radiation, microwave radiation, radar backscatter, or optical lightning flashes.
Algorithms then convert those measurements into retrieved or estimated variables, including:
- Cloud-top temperature
- Rainfall rate
- Atmospheric moisture
- Near-surface wind speed and direction
- Sea-surface temperature
- Ocean heat content
- Maximum sustained wind estimates
- Central-pressure estimates
Each product has limitations related to resolution, observation time, viewing angle, rainfall, and algorithm assumptions.
Step 6: Satellite Data Enter Forecast Models
Forecast models require an estimate of the current atmosphere and ocean before they can calculate future conditions.
The process of combining observations with a model’s previous estimate is called data assimilation.
Satellite observations can improve the model’s representation of:
- Atmospheric temperature
- Water vapor
- Winds at different heights
- Cloud properties
- Rainfall
- Sea-surface temperature
- Upper-ocean conditions
- The hurricane’s size and structure
- Weather systems surrounding the storm
A better starting state can improve a forecast, but it cannot eliminate uncertainty about how the atmosphere will evolve.
Step 7: Meteorologists Produce the Official Assessment
An official hurricane advisory is not generated automatically from one image, instrument, or forecast model.
Meteorologists compare:
- Satellite center fixes
- Satellite intensity estimates
- Aircraft reconnaissance
- Radar observations
- Surface measurements
- Ocean conditions
- Multiple forecast models
- Model trends and known biases
- The storm’s recent behavior
- Previous forecast performance
The final advisory is a human-reviewed scientific assessment of the combined evidence.
How Can Satellite Positions Be Used to Calculate Hurricane Movement?
Repeated center fixes can be used to estimate a hurricane’s motion.
The following is a short-distance educational approximation, not an operational geodesic calculation. For simplicity, the two positions are treated as points on a locally flat surface.
Suppose a storm center moves from:
- 20.0°N, 65.0°W
- to 20.8°N, 66.2°W
- during a six-hour period
Step 1: Estimate the North–South Distance
One degree of latitude is approximately 111 kilometers.
The latitude changes by 0.8°:
0.8 × 111 km ≈ 88.8 km
Step 2: Estimate the East–West Distance
Longitude lines become closer together away from the equator.
A useful local approximation is:
Distance per degree of longitude ≈ 111 × cos(latitude) kilometers
Near 20°N:
111 × cos(20°) ≈ 104 km per degree
The longitude changes by 1.2°:
1.2 × 10⁴ km ≈ 125 km
Step 3: Combine the Components
Using the Pythagorean relationship as a local approximation:
Total distance ≈ √(88.8² + 125²)
Total distance ≈ 153 km
Step 4: Calculate Forward Speed
The movement occurs over six hours:
153 km ÷ 6 hours ≈ 25.5 km/h
That is approximately:
- 16 mph
- 14 knots
What This Calculation Leaves Out
Operational forecast centers use more precise methods that account for:
- Earth’s curvature
- Exact observation times
- Center-location uncertainty
- Short-term center wobbles
- Relocation during reorganization
- Multiple center fixes
- Quality control and track smoothing
The practical lesson is simple:
One center position shows where the storm appears to be. A quality-controlled sequence of positions reveals how it is moving.
Which Types of Satellites Track Hurricanes?
The two main categories are geostationary satellites and polar-orbiting satellites.
Neither is universally better. They perform different jobs.
Table 1. Geostationary and polar-orbiting satellite roles
| Feature | Geostationary satellites | Polar-orbiting satellites |
|---|---|---|
| Orbit | Match Earth’s rotation above the equator | Circle Earth from pole to pole |
| Viewing pattern | Continuously observe the same broad region | Observe different areas during successive passes |
| Main strength | Frequent imagery and motion monitoring | Detailed global measurements from lower orbit |
| Main limitation | Viewing quality decreases near the edge of coverage | No continuous view of one storm from one satellite |
| Best uses | Cloud evolution, eye changes, lightning and motion | Temperature, moisture, rainfall and hidden structure |
| U.S. examples reviewed in 2026 | GOES-19 East and GOES-18 West | Suomi NPP, NOAA-20 and NOAA-21 |
Geostationary and polar-orbiting observations complement one another because they trade temporal frequency for spatial detail and global coverage.
How Geostationary Satellites Provide Continuous Tracking
A geostationary satellite orbits approximately 35,786 kilometers, or 22,236 miles, above Earth’s equator.
Its orbital motion matches Earth’s rotation, allowing it to remain over approximately the same longitude. Images collected at frequent intervals can then be assembled into animations.
These animations help meteorologists follow:
- Storm movement
- Eye development
- Changes in symmetry
- Cloud-top cooling or warming
- Upper-level outflow
- Dry-air interaction
- Convective bursts
- Eyewall changes
NOAA reported that GOES-19 entered operational service as GOES East on April 7, 2025, replacing GOES-16 in that role.
As of this review, GOES-16 and GOES-17 serve as on-orbit backups. These assignments should be checked periodically because operational roles can change.
How Polar-Orbiting Satellites Reveal More Detail
Polar-orbiting satellites fly much closer to Earth and travel over or near the poles while Earth rotates beneath them.
NOAA’s Joint Polar Satellite System includes the currently flying Suomi NPP, NOAA-20, and NOAA-21 spacecraft. JPSS satellites orbit Earth about 14 times per day and provide complete global coverage approximately twice daily.
Their instruments observe:
- Atmospheric temperature
- Atmospheric moisture
- Clouds
- Sea-surface temperature
- Rainfall structure
- Nighttime light
- Aerosols
- Land and ocean conditions
A polar-orbiting pass is a detailed snapshot rather than a continuous movie. Its value is greatest when interpreted alongside frequent geostationary imagery.
What Do Hurricane-Tracking Satellite Instruments Measure?
Different wavelengths reveal different parts of a hurricane.
No single instrument provides a complete picture.
Table 2. What major hurricane-observing instruments record
| Observation | Instrument records | Retrieved or interpreted information | Main limitation |
|---|---|---|---|
| Visible imagery | Reflected sunlight | Cloud bands, eye shape and low-level circulation | Primarily useful during daylight |
| Infrared imagery | Emitted thermal radiation | Cloud-top temperature and height patterns | High clouds can hide lower-level structure |
| Water-vapor imagery | Radiation in moisture-sensitive infrared bands | Broad moisture and upper-level flow patterns | Does not directly show surface humidity |
| Microwave imagery | Natural microwave radiation | Rain, ice, moisture and inner-core structure | Available mainly during satellite overpasses |
| Scatterometry | Microwave radar backscatter | Near-surface wind speed and direction | Rain and resolution can affect retrievals |
| Synthetic aperture radar | High-resolution radar backscatter | Detailed ocean-surface wind patterns | Requires targeted coverage |
| Lightning mapping | Brief optical flashes | Lightning location, extent and frequency | Lightning alone does not determine intensity |
| Sea-surface temperature | Thermal radiation near the ocean surface | Surface thermal conditions | Does not show the depth of warm water |
| Altimetry and ocean heat products | Sea-surface height and supporting observations | Upper-ocean structure and heat content | Derived using models and multiple datasets |
| Precipitation instruments | Microwave radiation and radar return | Rainfall rate and three-dimensional structure | Individual overpasses are snapshots |
Detect, Measure, Retrieve, and Estimate
These terms describe different stages of satellite observation:
- Detect: A sensor recognizes a signal, such as an optical lightning flash.
- Measure: An instrument records a physical quantity, such as infrared radiation or radar backscatter.
- Retrieve: An algorithm converts the recorded signal into a variable such as rainfall or wind.
- Estimate: A value is calculated using empirical relationships, models, or several evidence sources.
This distinction matters because many colorful satellite maps display retrieved or estimated variables—not direct measurements at the hurricane’s surface.
The same remote-sensing principle applies across other Earth-observation tasks, including wildfire and smoke detection and long-term climate monitoring.
What Does Visible Imagery Show?
Visible imagery records sunlight reflected from clouds and Earth’s surface.
High-resolution images may reveal:
- A clear or partially clear eye
- Low-level cloud spirals
- Curved rainbands
- An exposed circulation center
- Small gaps in an eyewall
- Changes in the outer cloud field
Visible imagery is intuitive, but ordinary visible products become unavailable after sunset.
Some polar-orbiting instruments, including the VIIRS Day/Night Band, can observe low-light conditions using moonlight and other faint illumination. These products are not identical to standard daytime visible imagery.
Why Is Infrared Imagery Important?
Infrared sensors measure emitted thermal radiation and work during both day and night.
High cloud tops are generally colder than lower clouds. Meteorologists use brightness-temperature patterns to examine:
- Deep convection
- Eyewall organization
- Central cloud cover
- Symmetry
- Warming or cooling trends
- Disruption caused by wind shear
Enhanced infrared colors usually represent selected cloud-top temperature ranges. They do not directly represent surface wind speed.
How Does Microwave Imagery Reveal Hidden Structure?
Microwave instruments can reveal rainfall and ice structures beneath many upper-level clouds that block visible and infrared views.
A microwave overpass may show:
- Whether an eyewall is open or closed
- The position of the rain-defined inner core
- Concentric eyewalls
- Asymmetric rainfall
- Curved bands wrapping around the center
- Structural disruption caused by wind shear
- Changes associated with an eyewall replacement cycle
Microwave instruments do not provide an unrestricted view through every cloud and rain condition. Sensor frequency, footprint size, heavy precipitation, and viewing geometry all affect the result.
Their main practical limitation is timing: a microwave image shows the storm during an overpass, not continuously between passes.
How Do Scatterometers Retrieve Ocean-Surface Winds?
A scatterometer sends microwave radar energy toward the ocean and records the returned backscatter.
Wind changes the small-scale roughness of the sea surface. Retrieval algorithms convert the backscatter pattern into estimates of near-surface wind speed and direction.
NOAA processes Advanced Scatterometer wind products from instruments aboard EUMETSAT Metop satellites.
Scatterometer data can help determine:
- Whether a closed circulation is present
- Which side of the storm has stronger winds
- How far the wind field extends
- Whether the circulation is becoming asymmetric
- Whether the estimated center agrees with cloud imagery
A scatterometer may miss a compact maximum wind if the strongest region is smaller than the instrument footprint. Heavy rain can also complicate some retrievals.
What Can Synthetic Aperture Radar Add?
When targeted coverage is available, synthetic aperture radar can provide high-resolution estimates of ocean-surface wind patterns.
SAR is not a continuous global hurricane monitor. Images must be acquired along a satellite’s path, and tropical-cyclone observations may require targeted collection and specialized processing.
NOAA has used SAR imagery from systems including Radarsat and Sentinel-1 to produce detailed tropical-cyclone wind maps for operational analysis. More information is available in NOAA’s overview of satellite observations of the ocean surface during hurricanes.
Synthetic aperture radar provides a complementary imaging method that can supply surface information through most cloud cover.
What Does Lightning Mapping Reveal?
The Geostationary Lightning Mapper detects brief optical changes associated with lightning.
Lightning trends can reveal changes in deep convection, including bursts within the eyewall or outer rainbands.
An increase in lightning may accompany storm reorganization or strengthening, but it is not a stand-alone hurricane intensity scale. Lightning must be interpreted alongside infrared imagery, microwave structure, wind shear, radar, and aircraft observations.
Why Are Sea-Surface Temperature and Ocean Heat Content Different?
Sea-surface temperature describes conditions close to the top of the ocean.
A hurricane can mix cooler water upward from below. If the warm layer is shallow, this mixing may reduce the heat available to the storm. If warm water extends much deeper, the ocean may remain supportive after substantial mixing.
NOAA’s Satellite Ocean Heat Content Suite combines sea-surface temperature, sea-surface height, and related ocean information to estimate upper-ocean thermal structure, including the depth of the 26°C isotherm.
Ocean heat content describes environmental potential. It does not prove that a hurricane will strengthen because wind shear, atmospheric moisture, internal storm structure, and other factors also matter.
How Do Satellites Estimate Hurricane Rainfall?
Microwave radiometers and precipitation radar record signals associated with liquid water, ice, and precipitation structure.
NASA’s Global Precipitation Measurement mission combines observations from the GPM Core Observatory with an international satellite constellation.
GPM products can reveal:
- Eyewall rainfall
- Curved rainbands
- Asymmetric precipitation
- Vertical storm structure
- Rainfall accumulation along a storm’s path
The GPM Microwave Imager and Dual-frequency Precipitation Radar provide detailed snapshots during individual overpasses. The IMERG system combines observations from multiple satellites to produce broader precipitation estimates over time.
Satellite rainfall values remain estimates. Over land, weather radar and rain gauges can confirm or refine them.
How Do Satellites Estimate Hurricane Intensity?
Satellite intensity techniques compare observable cloud patterns with relationships developed from tropical cyclones whose intensity was independently measured or estimated.
The best-known method is the Dvorak technique.
Dvorak analysis considers features such as:
- Curved cloud bands
- Central cloud organization
- Eye temperature
- Surrounding eyewall-cloud temperature
- Storm symmetry
- The center’s position relative to deep convection
- Changes in structure over time
The method assigns a classification related to estimated maximum sustained wind and central pressure.
The National Hurricane Center technical overview of the Dvorak technique explains how visible and infrared cloud patterns are related to tropical-cyclone intensity and where uncertainty can arise.
What Is the Advanced Dvorak Technique?
The Advanced Dvorak Technique, commonly called ADT, applies automated image processing and objective rules to infrared satellite data.
ADT can provide frequent intensity estimates, especially where routine aircraft reconnaissance is unavailable. It is not a direct anemometer or barometer reading from the storm.
Satellite estimates may disagree when:
- The storm center is uncertain
- The hurricane is changing rapidly
- An eyewall replacement cycle is underway
- Cloud appearance changes before surface winds respond
- The strongest winds are unusually compact
- Different algorithms interpret the structure differently
Operational centers compare satellite estimates with all other available evidence.
Does a Satellite Directly Determine the Hurricane Category?
Usually not.
The Saffir–Simpson Hurricane Wind Scale is based on maximum sustained surface wind. Satellite imagery and wind retrievals contribute to the operational estimate, but a cloud image does not independently assign an official category.
When available, meteorologists also use:
- Aircraft flight-level winds
- Dropsondes
- Stepped-frequency microwave radiometer observations
- Surface stations
- Buoys
- Radar-derived winds
- Scatterometer or SAR wind retrievals
Can Satellites Estimate Central Pressure?
Yes, but most satellite-derived central-pressure values are indirect estimates.
They may use:
- Cloud-pattern relationships
- Infrared eye and eyewall temperatures
- Estimated maximum winds
- Statistical wind-pressure relationships
- Consensus among several techniques
Aircraft dropsondes and surface instruments provide more direct pressure measurements when they pass through or near the center.
How Do Satellites Support Hurricane Track and Intensity Forecasts?
Satellites help define the storm’s current state and the environment through which it will move.
Forecast models then simulate how those conditions may evolve.
How Satellites Support Track Forecasting
A hurricane’s path is influenced by large-scale steering features, including:
- Subtropical high-pressure ridges
- Mid-latitude troughs
- Upper-level lows
- Nearby tropical systems
- Winds at different atmospheric heights
- The storm’s depth and structure
Water-vapor imagery reveals broad moisture and upper-level flow patterns. Atmospheric motion vectors derived from moving cloud and water-vapor features provide additional wind information.
Polar-orbiting sounders contribute temperature and moisture profiles over ocean regions with few conventional observations.
The division of labor is:
Satellites observe the hurricane and its surroundings. Models calculate plausible future paths. Forecasters evaluate the evidence and issue the official forecast.
What Does the Forecast Cone Mean?
The National Hurricane Center’s operational cone represents uncertainty in the predicted path of the tropical cyclone’s center.
The traditional cone is formed using circles based on the previous five years of official track errors. It is designed so that approximately two-thirds of historical center-position errors fall within the relevant circle at each forecast period.
The cone does not show:
- The full physical size of the storm
- The complete wind field
- Every area at risk of heavy rain
- Storm-surge coverage
- Tornado risk
- A boundary between safe and unsafe locations
Dangerous conditions can occur well outside it.
The current definition is available from the National Hurricane Center’s forecast-cone page.
Time-sensitive 2026 note: During the 2026 hurricane season, the National Hurricane Center is also issuing an experimental ellipse-based forecast cone alongside the operational product. The experimental method separately represents along-track and cross-track errors. Its status and design should be rechecked during future article reviews.
How Satellites Support Intensity Forecasting
Intensity forecasts require information about both the inner storm and the surrounding environment.
Four factors are especially important.
1. Inner-Core Organization
A closed eyewall, persistent deep convection, a warming eye, and symmetrical upper-level outflow may be consistent with strengthening.
Visual organization is not a guarantee. Cloud changes can lead or lag changes in surface winds.
2. Vertical Wind Shear
Vertical wind shear is a change in wind speed or direction with height.
Strong shear can tilt a hurricane’s circulation and move deep thunderstorms away from the low-level center.
Satellite imagery may show:
- An exposed circulation
- Convection concentrated on one side
- Restricted outflow
- A strongly asymmetric cloud shield
3. Atmospheric Moisture
Water-vapor imagery and model-analyzed moisture fields help identify dry air near the storm.
Dry air does not automatically weaken a hurricane. Its effect depends on whether it enters the inner circulation and disrupts persistent eyewall thunderstorms.
4. Upper-Ocean Thermal Conditions
Warm surface water is important, but the depth of the warm layer also matters.
Ocean heat products can identify currents, eddies, and deeper warm-water structures that may remain supportive after a hurricane mixes the upper ocean.
These products indicate environmental potential, not a guaranteed intensity change.
The Observe–Measure–Model Framework
A useful way to understand hurricane satellite tracking is to separate the evidence into three layers.
Layer 1: Observe
This layer answers:
- Where does the storm appear to be?
- How are the eye and cloud pattern changing?
- Is the storm becoming more symmetrical?
- Is the circulation exposed?
- How quickly are cloud features moving?
Frequent geostationary imagery is central to this layer.
Layer 2: Measure and Retrieve
This layer asks:
- What physical signals are the instruments recording?
- What winds, rainfall rates, temperatures, and moisture values can be retrieved?
- Is the eyewall closed?
- How large is the wind field?
- How much upper-ocean heat may be available?
Microwave instruments, scatterometers, precipitation radar, lightning sensors, altimeters, radiometers, and aircraft observations contribute to this layer.
Layer 3: Model
This layer asks:
- Where could the steering flow carry the storm?
- Will the environment become more or less favorable?
- How might the wind field change?
- How broad is the range of plausible outcomes?
Numerical models and human forecast analysis dominate this layer.
Why This Framework Matters
A dramatic satellite image belongs mainly to the observe layer.
It may show a clearer eye or colder cloud tops, but it cannot independently establish the exact surface wind, future category, or landfall location.
The strongest assessment comes from assigning each dataset a specific question rather than expecting one product to explain the entire storm.
An Editorial Confidence Rule
The following confidence rule was developed for this guide as an interpretation aid. It is not an operational rating system used by NOAA, NASA, or the National Hurricane Center.
Confidence Is Usually Higher When:
- Visible, infrared, microwave, radar, or wind products indicate a similar center.
- A structural trend persists across several images rather than appearing in one frame.
- Microwave or radar observations support the interpretation of the upper cloud pattern.
- Aircraft or surface measurements agree with satellite-derived estimates.
- Several forecast models begin from a reasonably well-observed storm structure.
- The storm is changing slowly enough for recent observations to remain representative.
Confidence Should Be Lower When:
- The low-level center is hidden beneath high clouds.
- Strong wind shear separates the circulation from the thunderstorms.
- The most recent microwave observation is several hours old.
- The strongest winds occupy an area smaller than the sensor footprint.
- Heavy rainfall may contaminate a wind retrieval.
- Different observing systems indicate different centers or structures.
- An eyewall replacement cycle is underway.
- The storm is reorganizing rapidly between overpasses.
This framework does not generate an official probability or replace professional analysis. It explains why some satellite interpretations are more secure than others.
Which Satellite Product Should You Use?
The most useful product depends on the question.
Table 3. A practical hurricane satellite product selector
| Your question | Best starting product | What to check next |
|---|---|---|
| Where is the hurricane now? | Latest geostationary loop | Official center position |
| How has it moved recently? | Animated geostationary imagery | Several official center fixes |
| Is the eye becoming clearer? | Visible imagery by day; infrared at night | Microwave inner-core structure |
| What is beneath the upper cloud shield? | Microwave imagery | Observation time |
| Where are ocean-surface winds strongest? | Scatterometer or targeted SAR product | Aircraft, buoy or radar data |
| Where is the heaviest rainfall? | Microwave or GPM rainfall product | Radar and gauges over land |
| Is dry air affecting the storm? | Water-vapor imagery | Model moisture fields |
| Is the ocean thermally favorable? | Sea-surface temperature and ocean heat content | Shear and storm structure |
| Is lightning increasing? | Geostationary lightning imagery | Infrared and radar trends |
| Is my location at risk? | Official warnings and local emergency information | Wind, surge, rain and evacuation products |
A Four-Question Decision Guide
- Want to watch current structural change? Use an animated geostationary visible or infrared loop.
- Are high clouds hiding the center? Find the most recent microwave overpass.
- Need the ocean wind field? Check scatterometer or targeted SAR products and verify their observation times.
- Making a safety decision? Use official warnings, forecasts, and local emergency instructions.
The Two-Clock Problem
Original interpretation note: The newest image is not always the most informative image.
“The Two-Clock Problem” is an explanatory label used in this guide, not an official NOAA product term.
Hurricane products frequently operate on different observation schedules:
- A geostationary infrared image may be only minutes old.
- The clearest microwave view of the eyewall may be several hours old.
- A scatterometer pass may describe the wind field at a third time.
- An official advisory may combine all of them into a later best estimate.
A newer infrared image may be best for identifying changes during the past hour. An older microwave pass may still contain the clearest available evidence about whether an eyewall was closed.
A careful interpretation therefore asks two questions:
- What physical feature does this product reveal?
- When was the observation actually collected?
Ignoring either question can lead to the wrong conclusion.
Hurricane Milton: How Different Evidence Sources Worked Together
Hurricane Milton in October 2024 illustrates why hurricane analysis requires several observing systems.
The case does not show that one satellite predicted the storm. It shows how different sources answered different questions.
Table 4. The division of evidence during Hurricane Milton
| Evidence source | Role in the analysis | What it could establish | What it could not establish alone |
|---|---|---|---|
| Geostationary imagery | Followed rapid eye and cloud changes | Continuous structural evolution | Exact maximum surface wind |
| Microwave and GPM observations | Revealed rainfall and inner-core organization | Eyewall and rainband structure | Continuous changes between passes |
| Ocean heat products | Identified deep warm water along the path | Environmental support for strengthening | Whether strengthening would occur |
| Aircraft reconnaissance | Measured pressure and winds inside the storm | Direct operational intensity evidence | Basin-wide environmental evolution |
| Forecast models | Simulated steering flow and future conditions | Plausible future scenarios | A guaranteed track or intensity |
| Human forecast analysis | Reconciled incomplete evidence | Official best assessment | Removal of all uncertainty |
The National Hurricane Center’s Hurricane Milton Tropical Cyclone Report documents that Milton developed a small, well-defined inner core and underwent explosive intensification on October 7, 2024.
Aircraft observations indicated that Milton’s central pressure fell from 977 millibars around 0325 UTC to an estimated 895 millibars by 2000 UTC. Maximum sustained winds increased to an estimated peak of 155 knots.
NOAA reported that Milton encountered high ocean heat content associated with the Loop Current and surrounding warm-water features. That evidence described an important energy source beneath the hurricane; it did not independently determine how rapidly or how much the storm would strengthen.
NASA’s GPM instruments observed detailed precipitation structure during selected overpasses, while the IMERG multi-satellite system provided a broader view of rainfall over time.
What the Milton Case Demonstrates
Each evidence source performed a different job:
- Ocean observations described the thermal environment.
- Geostationary imagery showed rapid visual evolution.
- Microwave and precipitation instruments revealed hidden rainfall structure.
- Aircraft tested whether satellite-inferred strengthening existed near the surface.
- Models explored possible future changes.
- Forecasters integrated the evidence.
No single source supplied the complete forecast.
That division of labor is the central logic of modern hurricane tracking.
What Can Weather Satellites Not Determine Alone?
Satellites are indispensable, but they do not eliminate the need for other observations, models, or professional judgment.
Satellites Cannot Guarantee a Landfall Point
The atmosphere continues to evolve after an observation is collected.
Small changes in a ridge, trough, storm depth, or forward speed can produce significant track differences over several days.
Satellites Cannot Remove Intensity Uncertainty
Rapid intensification, weakening, and eyewall replacement cycles can occur between detailed satellite overpasses.
Cloud appearance may also change before or after the strongest surface winds respond.
Satellites Cannot Fully Describe Local Hazards
Local risk depends on factors including:
- Terrain
- Drainage
- Coastal shape
- Building exposure
- River conditions
- Storm-surge modeling
- Tornado development
- The timing and duration of hazards
A satellite image cannot determine whether a particular building, road, or neighborhood is safe.
A Clear Eye Does Not Prove Strengthening
An eye may clear during:
- Intensification
- A steady period
- Recovery after an eyewall replacement cycle
- Temporary structural fluctuation
- The beginning of a weakening phase
A trend supported by several observations is more meaningful than one visually striking frame.
Common Mistakes When Reading Hurricane Satellite Images
Mistake 1: Treating Infrared Colors as Wind Speeds
Enhanced infrared colors normally represent cloud-top temperature ranges.
Very cold clouds indicate high, vigorous thunderstorms. They do not directly show the strongest surface wind.
Mistake 2: Assuming the Center Is Beneath the Coldest Clouds
Wind shear can push deep convection away from the low-level circulation.
Visible low clouds, microwave imagery, scatterometer winds, radar, or aircraft data may locate the center elsewhere.
Mistake 3: Judging Intensity From One Image
One frame cannot establish a reliable trend.
Use an animation and compare observations collected over several hours.
Mistake 4: Confusing Observation With Forecasting
A satellite image represents conditions at or near its observation time.
The projected path and future intensity come from forecast models and meteorologist analysis.
Mistake 5: Treating Retrieved Winds as Exact Measurements
Satellite wind products depend on:
- Sensor resolution
- Algorithm assumptions
- Viewing geometry
- Surface conditions
- Rain contamination
- Observation timing
A displayed value is not automatically an exact measurement at a particular house, boat, or coastline.
Mistake 6: Treating the Forecast Cone as the Storm’s Size
The cone describes uncertainty in the predicted path of the storm’s center.
Wind, rain, storm surge, tornadoes, and dangerous marine conditions can extend far beyond it.
Mistake 7: Ignoring the Timestamp
A detailed image may already be several hours old.
Always check:
- Observation time
- Time zone
- Whether the display uses UTC
- Whether the image is a composite
- Whether the latest frame is delayed
Practical Checklist for Reading Hurricane Satellite Imagery
Before drawing a conclusion from a satellite product, check the following:
- Product type: Is it visible, infrared, water vapor, microwave, lightning, rainfall, or wind imagery?
- Observation time: When were the data collected, and is the timestamp shown in UTC?
- Presentation: Is it one frame, an animation, a composite, or a model-overlay product?
- Variable: Does it show measured radiation, temperature, rain, lightning, wind, or an algorithm-derived estimate?
- Official center: Does the apparent center agree with the latest official advisory?
- Hidden structure: Could upper clouds conceal the low-level circulation or eyewall?
- Supporting evidence: Do microwave, radar, aircraft, buoy, or surface observations support the interpretation?
- Safety context: Are official watches, warnings, flood alerts, surge products, or evacuation instructions in effect?
The final check is the most important.
Satellite imagery can improve understanding, but it should not override official local safety guidance.
What Is the Practical Bottom Line?
Weather satellites track hurricanes by observing the same storm from complementary orbital perspectives.
Geostationary satellites provide frequent imagery that reveals movement and rapid cloud changes. Polar-orbiting instruments supply detailed snapshots of temperature, moisture, rainfall, and hidden inner-core structure. Scatterometers and targeted SAR products add estimates of ocean-surface winds, while lightning observations and ocean products describe other parts of the storm environment.
The most reliable interpretation follows three stages:
- Observe the storm’s location and visible structure.
- Measure or retrieve winds, rainfall, temperature, moisture, and ocean conditions.
- Model how the hurricane and surrounding atmosphere may evolve.
For general understanding, begin with an official geostationary satellite loop and compare it with the latest advisory.
For more detailed analysis, add microwave, scatterometer, rainfall, sounding, and ocean products while checking both their measurement purpose and timestamp.
For personal safety decisions, use official forecasts, local warnings, evacuation information, and emergency instructions. Satellite imagery is an observation tool, not a substitute for a location-specific hazard assessment.
Frequently Asked Questions
Can weather satellites measure the exact wind speed inside a hurricane?
Satellites can retrieve or estimate near-surface winds, but they do not always capture the exact maximum sustained wind.
The strongest winds may occupy an area smaller than a sensor’s footprint. Rain, viewing geometry, sampling time, and algorithm assumptions can also affect the result.
Forecasters compare satellite wind products with aircraft, radar, buoy, ship, and surface observations whenever those data are available.
Why does the reported hurricane center sometimes move suddenly?
The previous center estimate may have been uncertain, especially when high clouds concealed the low-level circulation or wind shear displaced the thunderstorms.
A new microwave image, scatterometer pass, radar observation, or aircraft mission may provide a better fix.
The circulation can also wobble over short periods while following a smoother overall track.
Can a weather satellite see through hurricane clouds?
It depends on the instrument.
Visible sensors mainly observe reflected light from cloud surfaces. Infrared instruments measure emitted thermal radiation from cloud tops and other surfaces. Microwave instruments can reveal rainfall and structural features beneath many upper clouds, although heavy precipitation and sensor characteristics still limit what can be retrieved.
Are Hurricane Hunter aircraft still necessary?
Yes.
Aircraft collect pressure, wind, temperature, and humidity measurements inside the storm. Dropsondes record conditions while falling through the atmosphere, and onboard instruments examine the wind field and inner core.
Satellites remain essential because they provide broad coverage over remote oceans and continuous regional monitoring that aircraft cannot provide alone.
How often are hurricane satellite images updated?
The interval depends on the satellite, instrument, geographic sector, and operating mode.
NOAA geostationary satellites normally provide frequent regional and full-disk imagery. A targeted Advanced Baseline Imager mesoscale sector can update approximately every 30 seconds under an appropriate scanning configuration.
Polar-orbiting microwave, sounding, and precipitation observations occur during individual overpasses rather than continuously.
Why can the forecast change when the satellite image looks similar?
The forecast depends on more than the hurricane’s visible appearance.
New observations may reveal changes in:
- A distant ridge or trough
- Vertical wind shear
- Atmospheric moisture
- Ocean conditions
- The depth of the circulation
- The estimated center
- Model agreement
A cloud pattern can appear nearly unchanged while the larger steering environment or model forecast changes.
Sources
NOAA NESDIS — Geostationary Satellites
Current GOES assignments, geostationary orbit, ABI capabilities, lightning observations, and rapid scanning.NOAA NESDIS — NOAA’s GOES-19 Now Operational as GOES East
GOES-19’s transition to operational GOES East service on April 7, 2025.NOAA NESDIS — Joint Polar Satellite System
Current JPSS spacecraft, orbit frequency, global coverage, and mission role.NOAA OSPO — Advanced Scatterometer Wind Products
ASCAT radar backscatter measurements and ocean-surface wind retrievals.NASA Global Precipitation Measurement Mission — Using GPM Data to Understand Hurricanes
Microwave and precipitation-radar observations of tropical-cyclone rainfall and structure.NOAA NCEI — Satellite Ocean Heat Content Suite
Sea-surface temperature, sea-surface height, isotherm depth, mixed-layer depth, and ocean heat-content products.National Hurricane Center — The Dvorak Tropical Cyclone Intensity Estimation Technique
Technical overview of satellite cloud-pattern intensity estimation and its limitations. PDF.National Hurricane Center — Definition of the NHC Track Forecast Cone
Official operational forecast-cone definition and interpretation.National Hurricane Center — 2026 Experimental Tropical Cyclone Forecast Cone
Time-sensitive description of the experimental ellipse-based cone issued during the 2026 season.National Hurricane Center — Tropical Cyclone Report: Hurricane Milton
John L. Beven II, Laura Alaka, and Cody Fritz, March 31, 2025. PDF.NOAA NESDIS — Satellites Studying the Ocean Surface for Hurricane Insights
Ocean heat content, altimetry, SAR wind products, and Hurricane Milton observations.NASA GPM — IMERG Observes Heavy Precipitation From Hurricane Milton
Multi-satellite rainfall estimates and detailed GPM observations during Milton.
More from Earth Observation & Mapping
How Do Satellites Detect Wildfires and Smoke?
Satellites detect wildfires by measuring unusual heat in infrared wavelengths, while visible, multispectral, and aerosol observations help analysts follow smoke across the atmosphere. This guide explains how systems such as GOES, VIIRS, MODIS, Landsat, and Sentinel contribute different pieces of the wildfire-monitoring picture. Readers will learn why a thermal hotspot is not the same as an exact fire perimeter, why satellite smoke imagery cannot replace ground-level PM2.5 measurements, and how clouds, terrain, viewing geometry, and satellite overpass timing can affect detection. The article also compares commonly used fire and smoke products, explains fire radiative power and the Normalized Burn Ratio, and provides a practical framework for choosing the right map. A documented Camp Fire example shows how multiple satellite and surface datasets can complement one another. Satellite information is valuable for situational awareness, but official emergency agencies remain the appropriate source for evacuation orders, road closures, and immediate safety decisions.
How Are Satellite Images Used in Agriculture?
Satellite images help farmers, agronomists, researchers, insurers, and public agencies monitor agricultural land across fields, regions, and growing seasons. This guide explains how optical, radar, thermal, and microwave satellite observations support crop-development monitoring, irrigation analysis, field mapping, flood and drought assessment, crop classification, and regional production forecasting. It distinguishes what satellites directly observe from calculated indices, classification results, and modeled estimates such as evapotranspiration. Readers will also learn how NDVI works, why spatial resolution and image timing matter, and when drones or field scouting are more appropriate. The original CosmoBasics SCALE Framework provides a practical way to decide whether satellite imagery fits a specific agricultural problem. Documented examples from USDA and OpenET show how operational products combine multiple observations, reference data, weather information, and models. Throughout the guide, satellite imagery is treated as a screening and monitoring tool—not a substitute for field verification, laboratory testing, or professional agricultural judgment.
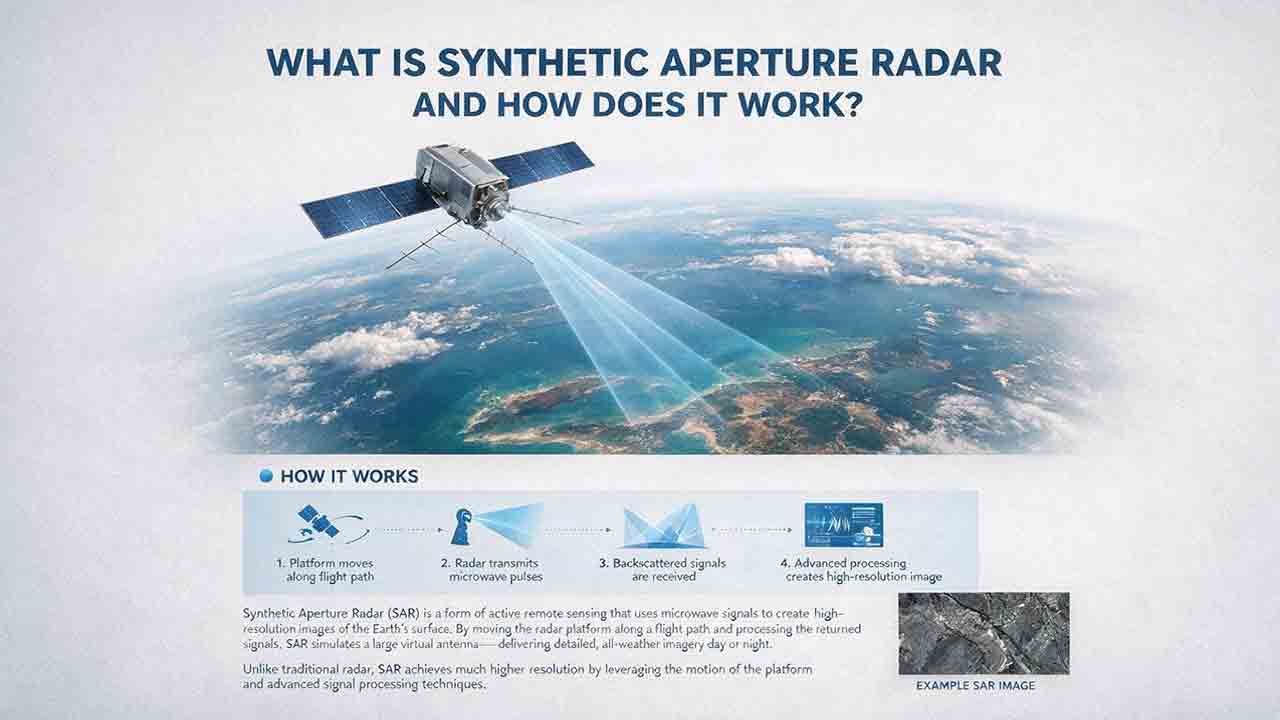
What Is Synthetic Aperture Radar and How Does It Work?
Synthetic aperture radar, or SAR, is an active Earth-observation technology that creates detailed images by transmitting microwave pulses and measuring the echoes returned from the surface. This article explains how a moving satellite or aircraft collects repeated observations to form a virtual antenna, why SAR can operate at night and through most cloud cover, and how amplitude, phase, wavelength, polarization, surface roughness, moisture, and viewing geometry affect radar imagery. It also distinguishes pixel spacing from true spatial resolution, provides a transparent range-resolution calculation, and compares SAR with optical satellite imagery. Practical sections examine scattering mechanisms, flood mapping, agriculture, forests, ice, maritime monitoring, and InSAR-based ground-deformation analysis. Original interpretation and data-selection frameworks help readers evaluate backscatter patterns, choose suitable products, identify common errors, troubleshoot unexpected results, and communicate uncertainty without treating derived radar products as guaranteed ground truth.
Explore More Topics
Why Does Your Phone Sometimes Show the Wrong Location?
A phone’s location can appear incorrect even when its GPS hardware is functioning normally. Modern smartphones estimate position by combining satellite signals with Wi-Fi, cellular networks, Bluetooth, motion sensors, app permissions, and map data. This guide explains how blocked or reflected signals, cached locations, approximate permissions, battery restrictions, compass errors, and inaccurate map pins can affect the blue dot. It introduces two practical CosmoBasics troubleshooting tools—the Two Apps, Two Places Rule and the PLACE Test—to help readers distinguish app problems, environmental interference, stale data, mapping errors, and possible device-level issues. The article also provides step-by-step fixes for iPhone and Android, explains realistic smartphone accuracy under open-sky and indoor conditions, and identifies when contacting the manufacturer may be appropriate. All major technical claims are supported by first-party documentation from GPS.gov, Apple, Android, Google Maps, and Google for Developers.
How Accurate Is Consumer GPS?
Consumer GPS can often estimate horizontal position within about 5 meters under open sky, but actual accuracy varies significantly with the device, satellite geometry, signal blockage, reflected signals, antenna placement, and software processing. This guide explains what GPS accuracy figures really mean, why an app’s accuracy circle is not the same as measured error, and why smartphone references, Android confidence estimates, and government GPS performance standards should not be treated as interchangeable. It introduces the CosmoBasics Target Separation Test, a practical framework for deciding whether GPS uncertainty is small enough for a specific task. Readers will also learn how smartphones combine GNSS, Wi-Fi, cellular data, and sensors; how dual-frequency reception may improve performance; why altitude is less reliable than horizontal position; and how to test and troubleshoot a device. The article clearly identifies situations where consumer GPS is useful and where professional, certified, or regulated positioning methods are necessary.
GPS vs GNSS: What Is the Difference?
GPS and GNSS are often used as if they mean the same thing, but they describe different levels of satellite navigation technology. GPS is the United States’ satellite navigation system, while GNSS is the broader category that includes GPS, Galileo, GLONASS, BeiDou, and compatible regional systems such as QZSS and NavIC. This guide explains how GPS-only and multi-GNSS receivers differ, why access to more constellations may improve signal availability, and why a larger satellite count does not automatically guarantee greater accuracy. It also examines dual-frequency reception, satellite geometry, antenna quality, correction services, sensor integration, and common positioning errors. Readers can use the Receiver Capability Stack, buying checklist, real-world examples, and troubleshooting steps to evaluate phones, watches, vehicle navigators, outdoor devices, survey receivers, and timing systems. The article is based on official technical documentation and clearly distinguishes educational examples from recognized GNSS performance standards.